Murray Math LevelsThe original script was posted on ProRealCode by user supertiti.
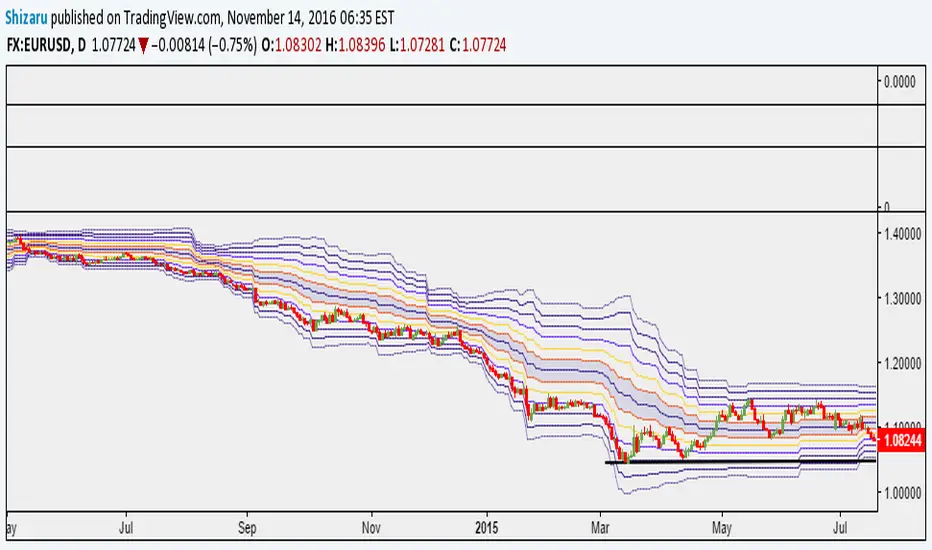
The Murray Math lines levels are determined within some principles of Gann levels and candlesticks formations. The Murray Math levels act pretty much like pivot and support/resistance areas.
1. Line 8/8 - 0/8 (Ultimate Support and Ultimate Resistance).
Those lines are the most strong concerning Support and resistance.
2. Line 7/8 (Weak, Place to Stop and Reverse).
This line is weak. If suddenly the price was going too fast and too far and stops around this line it means the price will reverse down very soon. If the price did not stop near this line this price will continue the movement to the line 8/8.
3. Line 1/8 (Weak, Place to Stop and Reverse).
This line is weak. If suddenly the price was going too fast and too far and stops around this line it means the price will reverse up very soon. If the price did not stop near this line this price will continue the movement down to the line 0/8.
4. Line 2/8 and 6/8 (Pivot, Reverse)
Those two lines yield the line 4/8 only to the strength to reverse the price movement.
5. Line 5/8 (Top of Trading Range)
The price is spending the about 40% of the time on the movement between the lines 5/8 and 3/8. If the price is moving near line 5/8 and stopping near the line during the 10 - 12 days so it means that it is necessary to sell in this "bonus zone" (some people are doing like this) but if the price is keeping the tendency to stay above 5/8 line, so it means that the price will be above. But if the price is droping below 5/8 line it means that the price will continue falling to the next level of resistance.
6. Line 3/8 (Bottom of Trading Range).
If the price is below this line and in uptrend it means that it will be very difficult for the price to break this level. If the price broke this line during the uptrend and staying above during the 10- 12 days it means that the price will be above this line during the 40% of its time moving between this line and 5/8 line.
7. Line 4/8 (Major Support/Resistance Line).
It is the major line concerning support and resistance. This level is the better for the new sell or buy. It is the strong level of support of the price is above 4/8. It is the fine resistance line if the price is below this 4/8 line.
"12月1日给海æ°æ‰«ç 手ç»è´¹"に関するスクリプトを検索
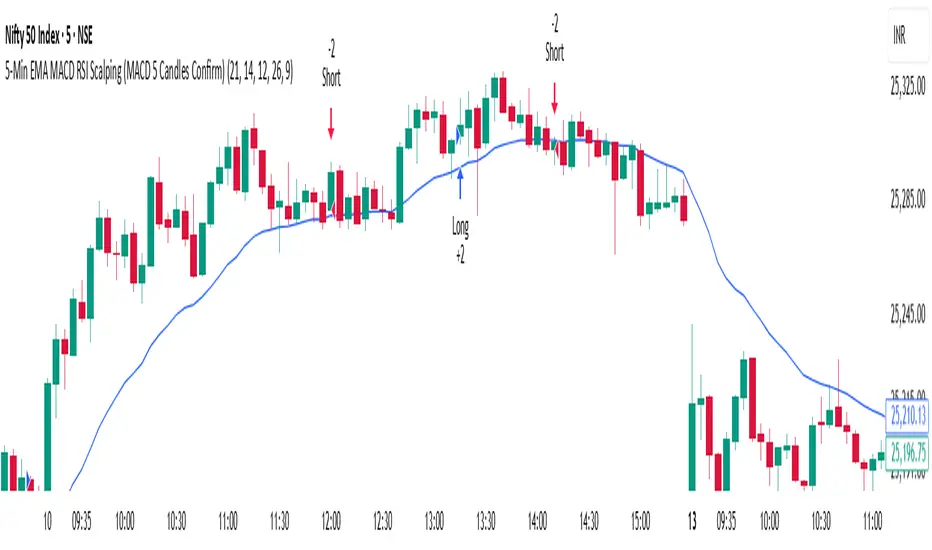
Candlestick Trend Indicator v0.5 by JustUncleLRequested Update to this Indicator alert project. In this update I have added the option to be able select which Price Action candles you want included in the display and the generated alarm Alert. Other changes also included in this update:
Also added a Price Action candle for "Last Fractal S/R Break", this also a good continuation indication.
Added option to select a different moving average types for directional MA line.
Modified some default settings, using HullMA instead of Zero Lag EMA and standard MACD settings(12,26,9).
Description:
This is a trend following indicator and alert for Binary Options based on Candlestick patterns and trend line -
NOTE: original system was a forex trading system.
This code combines a number of indicators to create an overall trading strategy.
The indicator recognises and displays some useful candle named defined patterns that are used to support trend continuation:
Bearish + Bullish PinBars
Dark Cloud Cover
Piecing Line
Bullish + Bearish Harami
Bullish + Bearish Engulfing Candle
Bullish + Bearish Last Fractal S/R break
Also recognises main Price Action candles from ChrisMoody (CM), the four(4) price action patterns are colored coded bars:
Yellow = Inside Bar - breakout/continuance
Orange = Outside Bar - breakout/continuance
Aqua/Fuschia = Up/Down Shaved Bars - Buying/Selling pressure
Red/Green = Possible reversal PinBars - Reverse Down / reverse Up
The highlighted candles (maroon and darker green) represent the defined PA patterns that have been confirmed following the current trend direction that is indicated by the Hull MA(20) line (can select a different type of MA, or even disable) and confirmed by MACD direction (can be disabled). The confirmed Alerts are indication by green (buy) and red (sell) dots at the bottom of the chart. An alert is generated from this selection for the alert condition of the alarming system.
The fractal upper/lower break lines are also draw, if the (optional) last fractal break line is broken by a highlighted bar then this indicates a stronger trend conformation.
The MACD indicator MACD DEUTER 2 colour(12,26,9) you can visually see the MACD histogram colours with MACD direction - needs "MACD DEUTER 2 colour" indicator.
This multi-indicator set up is suitable for 1hr, 4hr and daily charts with 1-4 candle expiry.
References and Inspiration from:
Fractal Levels by RicardoSantos
Almost Zero Lag EMA
Candlestick Patterns With EMA by rmwaddelljr
CM_Price-Action-Bars by ChrisMoody
www.forexstrategiesresources.com
"Scalp Jockey - MTF MA Cross Visual Strategizer by JayRogers"

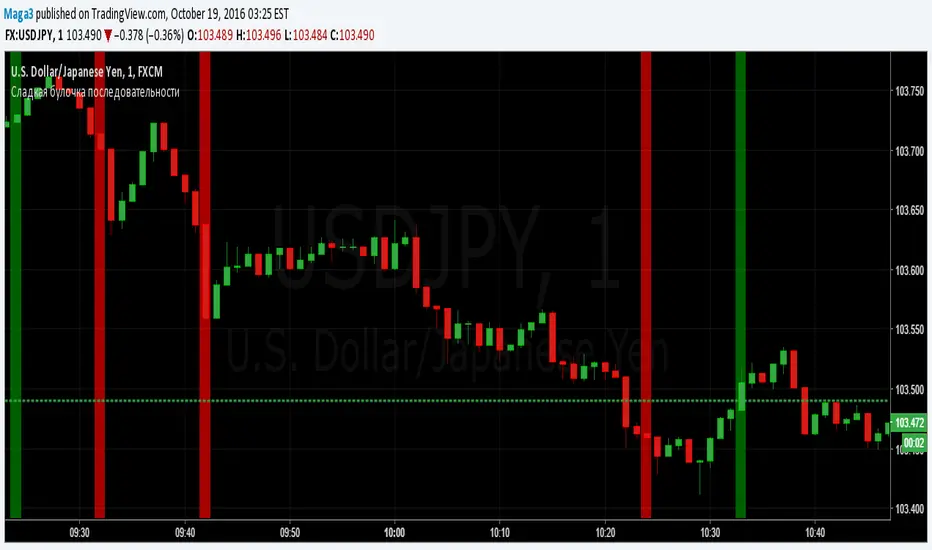
Sladkaya Bulochka PosledovatelnostiSerial number of the same color candles - a popular method of how to find the exact entry zones and determine the trends and kickbacks.
The number of consecutive candles usually starts from 3 and up to 12 in some strategies.
5 candles in sequence - one of the most popular signals. Login at the close of the 5th candle.
---------------------------------------------
Последовательное число свечей одинакового цвета - популярный метод как поиска точных зон входа, так и определения трендов и откатов.
Число последовательных свечей, как правило, начинается с 3 и доходит до 12 в некоторых стратегиях.
5 свечей в последовательности - один из наиболее популярных сигналов. Вход на закрытии 5й свечи.
MACD trend heatmap (by ChartArt)This is an overlay indicator which uses the classic period settings and signals from the MACD (Moving Average Convergence/Divergence) indicator to overlay a heatmap using all the information the MACD generates with its three periods (12,26,9).
The first two moving averages which the MACD uses (12 and 26) can be plotted on the chart like usual EMAs.
In addition to the background color function (the heatmap) and the EMAs, there is an optional bar color alert when the uptrend or the downtrend as measured by the MACD appears to be very strong.

Stoch_VX2Nothing New about a Stochastic but maybe in how you use them ( Other than Over bought / Sold cross over & divergence signals )
Running 3 bands
Standard stoch & tops & bottoms swing band
Optimised variables 12, 5 , 3 or fib 13, 5, 3 / - 12 / 3 / 3 a little bit tighter to combine both smoothness & accuracy. These are my own personal setting inc. Strategy.

MACD Color Trawler (by ChartArt)This version of the MACD indicator is 'trawling' (checking) if the MACD histogram and the zero line crossing with the MACD line are both positive or negative. The idea behind this is to show areas with higher or lower risk.
Features:
1. Enable the bar color
2. Enable the background color
3. Change zero line value
FYI:
"The MACD-Histogram is an indicator of an indicator. In fact, MACD is also an indicator of an indicator. This means that the MACD-Histogram is the fourth derivative of price."
First derivative: 12-day EMA and 26-day EMA
Second derivative: MACD (12-day EMA less the 26-day EMA)
Third derivative: MACD signal line (9-day EMA of MACD)
Fourth derivative: MACD-Histogram (MACD less MACD signal line)
Source: stockcharts.com

byquan GP - SRSI Channel🔍 What Is It?
The GP – SRSI Channel is a momentum-based oscillator that measures the relative strength of price movements across multiple timeframes using the Stochastic RSI (SRSI) method.
Instead of using a single RSI line, this indicator analyzes four price inputs and four timeframes to create a dynamic channel that reflects the true market momentum — helping traders identify overbought and oversold zones with higher accuracy.
⚙️ How It Works
The indicator combines multiple layers of analysis to produce a smooth and reliable momentum channel.
1. Multi-Source RSI Calculation
It computes RSI and Stochastic RSI values for four different price sources:
Open
High
Low
Close
Each source generates its own SRSI value:
dsopen, dshigh, dslow, and dsclose
From these, it extracts:
starraymin: the lowest (most oversold) SRSI value
starraymax: the highest (most overbought) SRSI value
This forms a momentum range based on all price inputs.
2. Multi-Timeframe (MTF) Integration
To strengthen signal reliability, it repeats this SRSI analysis across four higher timeframes (configurable by user):
Parameter Default Value Meaning
Time 1 180 minutes 3-hour chart
Time 2 360 minutes 6-hour chart
Time 3 720 minutes 12-hour chart
Time 4 1D Daily chart
Each timeframe produces its own set of minimum, maximum, and close SRSI values.
These are then combined and normalized to a 0–100 scale.
3. Normalization and Channel Plot
The combined results create three main lines:
Min Line (Green–Red gradient) → represents oversold strength
Max Line (Green–Red gradient) → represents overbought strength
Close Line (White) → represents average SRSI value
The area between the Min and Max lines is filled with a color gradient to form the SRSI Channel, visually showing momentum strength and range.
4. Signal & Alerts
Two alert levels are defined:
Alert Min Level → Default = 5 (oversold)
Alert Max Level → Default = 95 (overbought)
When:
oranmin ≤ Alert Min Level → Market is in an oversold state (potential reversal up).
oranmax ≥ Alert Max Level → Market is in an overbought state (potential reversal down).
When either of these thresholds is crossed, the indicator triggers:
A white square marker on the chart.
A custom alert with the message:
“SRSI Channel reached alert threshold (oranmax ≥ MaxLevel or oranmin ≤ MinLevel)”
🧭 How to Use It
🪄 Step 1 — Add to Chart
Copy the code into a new Pine Script in TradingView.
Click Add to chart.
You’ll see three lines and a colored channel between them.
⚙️ Step 2 — Adjust Inputs
Core SRSI Settings
Setting Description
K, D Smoothing factors for Stochastic RSI.
RSI Length Number of bars for RSI calculation.
S Length Period used for %K in Stochastic RSI.
Alert Min/Max Level Defines oversold/overbought zones.
Multi-Timeframe Settings
Change Time 1 to Time 4 to suit your trading style:
Shorter timeframes → faster but more noise.
Longer timeframes → smoother, more reliable momentum.
📈 Step 3 — Interpret the Chart
Indicator Element Meaning
🟩 Lower Boundary (Min) Lowest SRSI reading → momentum weakness / possible rebound area
🟥 Upper Boundary (Max) Highest SRSI reading → strong momentum / possible exhaustion
⚪ Middle Line (Close) Average of all SRSI readings → overall momentum strength
🌈 Channel Fill Visualizes balance between overbought and oversold levels
When the channel widens → market volatility and strength increase.
When it narrows → consolidation or low-momentum phase.
🔔 Step 4 — Alerts
You can create alerts using:
Condition: SRSI Extreme
Message: SRSI Channel reached alert threshold
Use this to receive notifications when the market hits extreme momentum levels (great for reversal traders).
💡 Trading Tips
✅ Combine with Supertrend, MACD, or Moving Averages for confirmation.
✅ Look for SRSI extremes aligning with price support/resistance for stronger reversal entries.
✅ Use different timeframe combinations (e.g., 1H–4H–12H–1D) depending on your trading style.
✅ Treat it as a momentum filter — not a direct buy/sell signal tool.
⚖️ Summary
The GP – SRSI Channel is a sophisticated multi-timeframe momentum indicator that helps traders visualize market strength and identify overbought or oversold conditions with exceptional clarity.
Features:
4 price sources × 4 timeframes = deep momentum insight
Dynamic, color-coded SRSI channel
Built-in alert system for extreme conditions
Clean and intuitive visual design
Best suited for:
Swing and position traders
Traders who use RSI/Stoch indicators
Those seeking to confirm entries with multi-timeframe momentum data
🎯 Understand the market’s true momentum — before it moves.
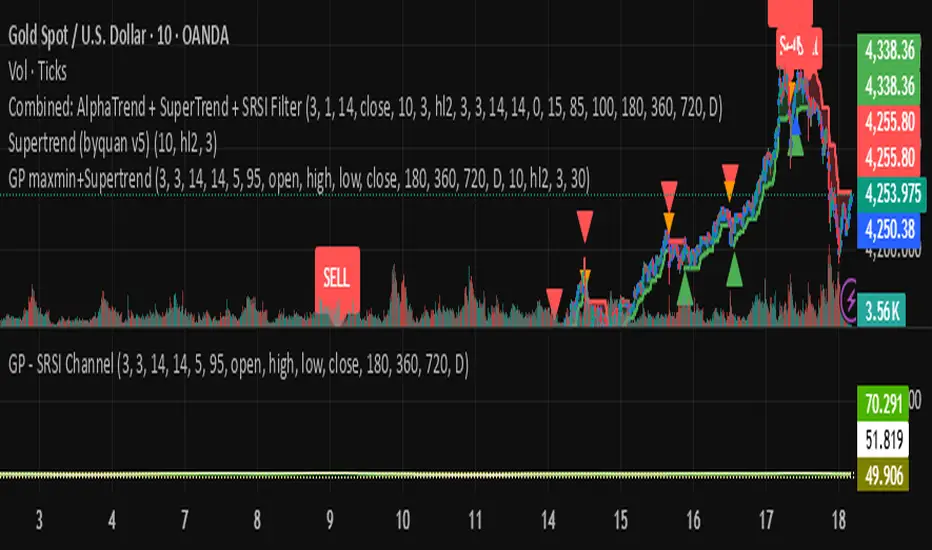
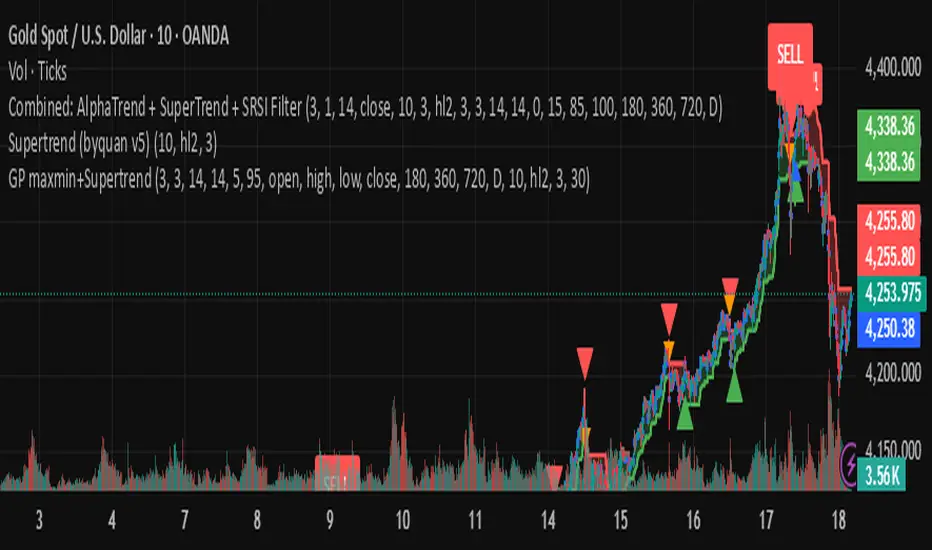
byquan GP maxmin+Supertrend🔍 Overview
The GP MaxMin + Supertrend indicator is an advanced trend-following tool that combines the power of the Supertrend indicator with a multi-timeframe Stochastic RSI (SRSI) filter.
It aims to generate high-confidence buy and sell signals by confirming Supertrend breakouts only when the market’s momentum (based on SRSI) supports them.
In other words:
Supertrend gives you trend direction,
and SRSI ensures you only trade when the market is ready to move.
⚙️ How It Works
The indicator operates in three main layers:
1. SRSI Channel Analysis
It calculates Stochastic RSI values on four price sources:
Open
High
Low
Close
From these, it extracts both minimum (oversold) and maximum (overbought) SRSI readings.
To make the signal more robust, the script collects SRSI data from four different timeframes:
3 hours (180 minutes)
6 hours (360 minutes)
12 hours (720 minutes)
1 day
These multi-timeframe readings are averaged and normalized between 0 and 100.
Key thresholds:
Below 5 → Oversold zone (potential BUY zone)
Above 95 → Overbought zone (potential SELL zone)
2. Supertrend Core
The indicator uses a standard Supertrend logic:
ATR Period: 10
ATR Multiplier: 3.0
It dynamically plots the Supertrend line that shifts between bullish and bearish zones.
When the price crosses the Supertrend line, a trend change is detected:
From bearish to bullish → Buy signal
From bullish to bearish → Sell signal
3. SRSI-Based Signal Filtering
To avoid false breakouts, the Supertrend signals are filtered through the SRSI logic.
Here’s how it works:
When the market becomes oversold, the script records that event.
If a Supertrend Buy signal appears within a certain number of bars (default = 30) after that oversold event → the signal is validated.
The same applies for Sell signals after an overbought event.
This creates a smart “confirmation window,” ensuring that only those Supertrend signals that align with market momentum are displayed.
🧭 How to Use It
✅ Step 1: Add to Your Chart
Copy and paste the script into a new Pine Script editor window in TradingView, then click “Add to chart.”
✅ Step 2: Configure Parameters
SRSI Settings
K, D, RSI Length, S Length: Standard SRSI parameters.
Alert Min Level and Alert Max Level: Define overbought/oversold zones (default 5 and 95).
Timeframes: You can adjust the four MTF levels if you want faster or slower momentum confirmation.
Supertrend Settings
ATR Period: A higher value smooths the trend.
ATR Multiplier: Controls signal sensitivity (lower = more signals, higher = fewer).
Filter Settings
Signal Filter Window: Defines how long after an overbought/oversold event a Supertrend signal remains valid (default = 30 bars).
✅ Step 3: Interpret Signals
Signal Type Condition Interpretation
Buy Supertrend flips to bullish and SRSI was recently oversold Start of an uptrend
Sell Supertrend flips to bearish and SRSI was recently overbought Start of a downtrend
Each signal is marked on the chart:
🟢 Green “Buy” label → potential long entry
🔴 Red “Sell” label → potential short entry
You can also enable or disable background highlighting to visually track bullish/bearish zones.
✅ Step 4: Set Alerts
You can create alerts using the built-in alert condition:
SRSI-Filtered SuperTrend Signal Triggered!
This triggers whenever a filtered Buy or Sell signal appears.
💡 Trading Tips
Combine this indicator with price action or volume confirmation for best results.
Adjust the filter window to fit your preferred timeframe (short-term vs swing trading).
Avoid trading against higher-timeframe Supertrend direction.
⚖️ Advantages
✅ Filters out false Supertrend signals
✅ Uses multi-timeframe momentum confirmation
✅ Clean visual layout with clear entry markers
✅ Supports alerts for automation or notifications
⚠️ Limitations
⚠️ The indicator is computationally heavy due to multi-timeframe requests.
⚠️ It’s a confirmation tool — not a standalone strategy.
⚠️ Results depend on correct parameter tuning for your market and timeframe.
📈 Summary
The GP MaxMin + Supertrend is a hybrid indicator that blends trend detection with momentum filtering.
It helps traders:
Avoid false breakouts
Enter trades at better timing
Stay aligned with both trend and momentum
Perfect for swing traders, crypto traders, and anyone who wants cleaner Supertrend signals with deeper confirmation logic.
Swing Breakout Strategy ver 1Overview
A multi-confirmation swing strategy that seeks trend breakouts and adds three optional confluence modules: candlestick patterns, RSI/MACD regular divergences, and simple chart patterns (double top/bottom). Built for clarity, fast testing, and togglable debug markers.
Core Logic
Trend filter: SMA(50) vs SMA(200) + price vs SMA(21).
Breakout engine: Close breaks prior N-bar high/low (lookback configurable).
Momentum: Stochastic cross (optional view), MACD cross/zone, RSI regime (>50 or <50).
Volume: Above SMA(volume) filter.
Optional Confluence Modules
Candlestick analysis (enable/disable):
Bull/Bear Engulfing, Hammer, Shooting Star, Inside Bar (bull/bear flavors).
Divergence (enable/disable):
Regular divergences on RSI and MACD histogram using confirmed pivots (HH/LH or LL/HL).
Chart patterns (enable/disable):
Double Bottom (two similar lows + neckline break).
Double Top (two similar highs + neckline break).
Tolerance and pivot width are configurable.
Entries & Exits
Entry Long: Any of (Base Breakout + Trend + Momentum + Volume) OR enabled confluences (candles / divergence / pattern).
Entry Short: Symmetric logic for downside.
Risk management: Optional ATR-based stop loss and take profit (configurable length & multipliers).
Note: If you prefer confluences to be filters (AND), change the final buySignal/sellSignal lines accordingly.
Inputs (key)
SMA lengths (21/50/200), RSI length, Stochastic lengths & smoothing, MACD (12/26/9).
Breakout lookback, Volume SMA.
ATR exits (on/off, ATR length, SL/TP multipliers).
Toggles for Candlesticks, Divergences, Patterns, plus per-module debug markers.
Plots & Markers
Plots SMA 21/50/200.
Buy/Sell arrows on chart.
Optional debug markers for each condition (global-scope safe).
Divergence/pattern markers offset to the actual pivot/neckline bars.
Good Practices
Test on multiple timeframes and instruments; tune lookbacks and ATR multipliers.
Consider using the modules as filters in trending markets to reduce whipsaws.
Always forward-test and combine with position sizing.
Disclaimer
For educational purposes only. This is not financial advice. Trading involves risk.
Version & Credits
Pine Script® v6 — Strategy.
Developed by: Mohammed Bedaiwi.

Easy-Read MACD (Signals & Zones)This Pine Script transforms the traditional MACD into a much clearer, more visual momentum tool. It calculates the standard MACD (12, 26, 9) and then enhances readability using color cues and signal markers. The histogram bars dynamically change brightness to show whether momentum is strengthening or weakening — bright green/red means increasing strength, while faded colors mean losing momentum.
Background colors further simplify interpretation: green when MACD is above zero and above the signal (bullish), red when below zero and below the signal (bearish), and pale yellow in neutral or transition periods. Arrows clearly mark signal-line and zero-line crossovers, giving instant visual confirmation of bullish or bearish momentum shifts. The indicator also includes optional alerts for these events, so you can get notified when momentum flips even without watching the chart.
⚡ Quick-Read Sheet
Green background:
→ MACD > 0 and above signal — bullish momentum zone. Market trending up.
Red background:
→ MACD < 0 and below signal — bearish momentum zone. Market trending down.
Yellow background:
→ Transition or sideways momentum. Trend is uncertain — avoid strong directional trades.
Bright green histogram bars:
→ Positive momentum increasing — bulls gaining strength.
Faded green histogram bars:
→ Positive momentum weakening — rally may be losing steam.
Bright red histogram bars:
→ Negative momentum increasing — bears gaining control.
Faded red histogram bars:
→ Negative momentum weakening — possible bottoming or reversal setup.
Up arrow “MACD↑Sig”:
→ MACD crosses above signal line — bullish shift, potential buy or long continuation signal.
Down arrow “MACD↓Sig”:
→ MACD crosses below signal line — bearish shift, possible sell or short signal.
Up arrow “MACD>0”:
→ MACD crosses above zero line — confirms bullish trend bias.
Down arrow “MACD<0”:
→ MACD crosses below zero line — confirms bearish trend bias.

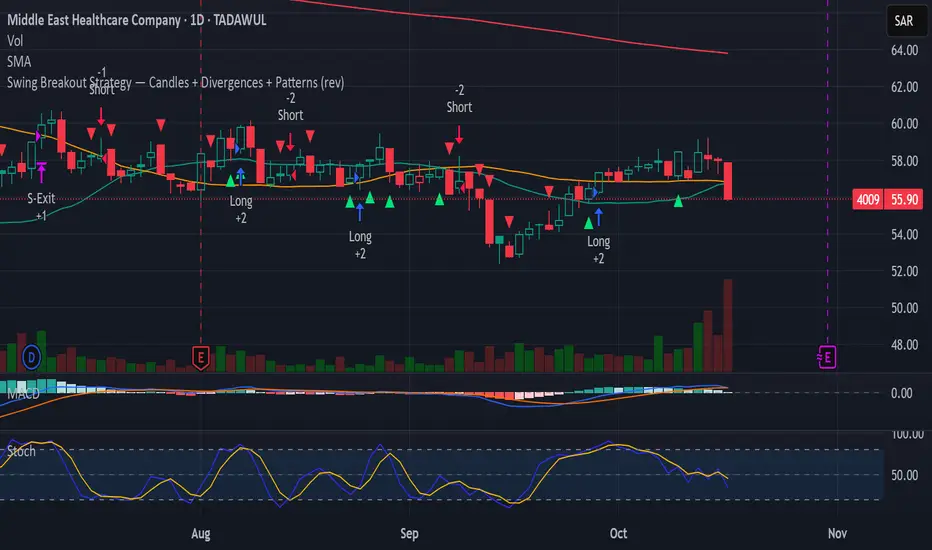
Swing Breakout Strategy — Candles + Divergences + Patterns (rev)Overview
A multi-confirmation swing strategy that seeks trend breakouts and adds three optional confluence modules: candlestick patterns, RSI/MACD regular divergences, and simple chart patterns (double top/bottom). Built for clarity, fast testing, and togglable debug markers.
Core Logic
Trend filter: SMA(50) vs SMA(200) + price vs SMA(21).
Breakout engine: Close breaks prior N-bar high/low (lookback configurable).
Momentum: Stochastic cross (optional view), MACD cross/zone, RSI regime (>50 or <50).
Volume: Above SMA(volume) filter.
Optional Confluence Modules
Candlestick analysis (enable/disable):
Bull/Bear Engulfing, Hammer, Shooting Star, Inside Bar (bull/bear flavors).
Divergence (enable/disable):
Regular divergences on RSI and MACD histogram using confirmed pivots (HH/LH or LL/HL).
Chart patterns (enable/disable):
Double Bottom (two similar lows + neckline break).
Double Top (two similar highs + neckline break).
Tolerance and pivot width are configurable.
Entries & Exits
Entry Long: Any of (Base Breakout + Trend + Momentum + Volume) OR enabled confluences (candles / divergence / pattern).
Entry Short: Symmetric logic for downside.
Risk management: Optional ATR-based stop loss and take profit (configurable length & multipliers).
Note: If you prefer confluences to be filters (AND), change the final buySignal/sellSignal lines accordingly.
Inputs (key)
SMA lengths (21/50/200), RSI length, Stochastic lengths & smoothing, MACD (12/26/9).
Breakout lookback, Volume SMA.
ATR exits (on/off, ATR length, SL/TP multipliers).
Toggles for Candlesticks, Divergences, Patterns, plus per-module debug markers.
Plots & Markers
Plots SMA 21/50/200.
Buy/Sell arrows on chart.
Optional debug markers for each condition (global-scope safe).
Divergence/pattern markers offset to the actual pivot/neckline bars.
Good Practices
Test on multiple timeframes and instruments; tune lookbacks and ATR multipliers.
Consider using the modules as filters in trending markets to reduce whipsaws.
Always forward-test and combine with position sizing.
Disclaimer
For educational purposes only. This is not financial advice. Trading involves risk.
Version & Credits
Pine Script® v6 — Strategy.
Developed by: Mohammed Bedaiwi.
Smart Structure Pro - Market Structure & Smart Money Concepts═══════════════════════════════════════════════════════════════════════════════
SMART STRUCTURE PRO
═══════════════════════════════════════════════════════════════════════════════
A comprehensive market structure analysis tool that identifies institutional trading
patterns and smart money concepts for improved trade timing and decision-making.
═══════════════════════════════════════════════════════════════════════════════
📊 WHAT IT DOES
═══════════════════════════════════════════════════════════════════════════════
This indicator automatically detects and visualizes key market structure elements:
🔹 BOS (Break of Structure)
- Identifies trend continuation patterns
- Marks when price breaks above previous highs (bullish) or below previous lows (bearish)
- Confirms trend strength and momentum
🔹 CHoCH (Change of Character)
- Detects potential trend reversals
- Alerts when market structure shifts from bullish to bearish or vice versa
- Helps identify early reversal opportunities
🔹 Order Blocks
- Highlights institutional entry zones
- Identifies the last opposite candle before a structure break
- Shows areas where smart money likely entered positions
🔹 Fair Value Gaps (FVG)
- Detects price imbalances and inefficiencies
- Shows areas where price moved rapidly leaving gaps
- Often act as support/resistance when retested
🔹 Liquidity Zones
- Marks swing high and low levels
- Identifies areas where stop losses likely cluster
- Shows potential stop hunt and liquidity grab zones
═══════════════════════════════════════════════════════════════════════════════
🎯 HOW TO USE
═══════════════════════════════════════════════════════════════════════════════
BULLISH SETUP:
1. Wait for Bullish CHoCH (trend reversal signal) or BOS ↑ (continuation)
2. Look for price to pull back into an Order Block or Fair Value Gap
3. Enter long when price bounces from these zones
4. Place stop loss below the Order Block
5. Target the next liquidity zone or resistance level
BEARISH SETUP:
1. Wait for Bearish CHoCH (trend reversal signal) or BOS ↓ (continuation)
2. Look for price to retrace into an Order Block or Fair Value Gap
3. Enter short when price rejects from these zones
4. Place stop loss above the Order Block
5. Target the next liquidity zone or support level
DASHBOARD INTERPRETATION:
• Trend: Current market direction (Bullish/Bearish)
• Volume: Confirmation strength (High volume = stronger signals)
• Signal: Latest structure break detected
• Key High/Low: Critical levels for the current trend
• Position: Price location (Premium = expensive, Discount = cheap)
═══════════════════════════════════════════════════════════════════════════════
⚙️ SETTINGS GUIDE
═══════════════════════════════════════════════════════════════════════════════
STRUCTURE DETECTION:
• Pivot Length (Default: 10)
- Lower values = More signals but potentially weaker
- Higher values = Fewer signals but stronger/more reliable
- Recommended: 8-12 for intraday, 10-15 for higher timeframes
• Structure Line Extension
- Visual preference for how far lines extend
- Does not affect signal detection
SMART MONEY CONCEPTS:
• Order Block Extension: How long OB boxes remain visible
• FVG Extension: How long gap boxes remain visible
• Min FVG Size: Filter out small gaps (0 = show all)
- Set to 10-20% to reduce noise
- Set to 0 to see all gaps
VOLUME FILTER:
• Volume Confirmation (Recommended: ON)
- Filters weak signals without volume support
- Reduces false breakouts
• Volume Multiplier (Default: 1.5)
- Higher = Stricter filtering (fewer but stronger signals)
- Lower = More signals (but may include weak ones)
DISPLAY:
• Dashboard: Toggle information panel
• Trend Background: Subtle color tint showing current trend
• Dashboard Position: Choose corner placement
═══════════════════════════════════════════════════════════════════════════════
🔔 ALERTS
═══════════════════════════════════════════════════════════════════════════════
Available alert conditions:
✓ Bullish BOS - Uptrend continuation confirmed
✓ Bearish BOS - Downtrend continuation confirmed
✓ Bullish CHoCH - Reversal to uptrend detected
✓ Bearish CHoCH - Reversal to downtrend detected
✓ Structure Break - Any significant market structure change
To set up alerts:
1. Click the "⏰" alert icon
2. Select "Smart Structure Pro"
3. Choose your desired condition
4. Configure notification method
5. Click "Create"
═══════════════════════════════════════════════════════════════════════════════
⚠️ IMPORTANT DISCLOSURES
═══════════════════════════════════════════════════════════════════════════════
REPAINTING BEHAVIOR:
• Pivot points WILL repaint until confirmed (this is by design and unavoidable)
• Structure breaks (BOS/CHoCH) use CLOSED candles and do NOT repaint after confirmation
• Order Blocks and FVGs are drawn on confirmed signals and do NOT repaint
• All signals wait for candle close before triggering
BEST PRACTICES:
• Use on higher timeframes (15min+) for more reliable signals
• Combine with other analysis (support/resistance, volume profile, etc.)
• Wait for candle close confirmation before acting on signals
• Use proper risk management - this is not a standalone trading system
• Backtest on your preferred instrument and timeframe
PERFORMANCE:
• Limited to 100 boxes, 100 lines, 100 labels for optimal performance
• Older objects automatically removed as new ones appear
• Works on all markets (Forex, Crypto, Stocks, Indices, Commodities)
═══════════════════════════════════════════════════════════════════════════════
📚 CONCEPTS EXPLAINED
═══════════════════════════════════════════════════════════════════════════════
MARKET STRUCTURE:
Market structure refers to the pattern of price movements creating swing highs
and lows. Understanding structure helps identify trend direction and potential
reversal points.
SMART MONEY CONCEPTS:
These are trading techniques based on tracking institutional order flow and
understanding where large players (banks, funds, institutions) enter and exit
positions.
ORDER BLOCKS:
The last opposing candle before a strong directional move. Institutions often
leave unfilled orders in these zones, which can act as support/resistance when
price returns.
FAIR VALUE GAPS:
Areas where price moved so quickly that it left an imbalance. These gaps often
get "filled" as price returns to find equilibrium, creating trading opportunities.
═══════════════════════════════════════════════════════════════════════════════
🎓 EDUCATIONAL VALUE
═══════════════════════════════════════════════════════════════════════════════
This indicator helps traders:
✓ Understand market structure mechanics
✓ Identify institutional trading patterns
✓ Improve trade timing and entry precision
✓ Recognize trend continuation vs reversal
✓ Learn smart money concepts through visualization
═══════════════════════════════════════════════════════════════════════════════
📋 TECHNICAL DETAILS
═══════════════════════════════════════════════════════════════════════════════
• Version: 1.0.0
• Pine Script Version: 5
• Indicator Type: Overlay
• No Repainting: Structure breaks use confirmed candles
• Performance Optimized: Limited drawing objects
• Works On: All markets and timeframes
• Alerts: Yes, fully customizable
═══════════════════════════════════════════════════════════════════════════════
👤 AUTHOR
═══════════════════════════════════════════════════════════════════════════════
Created by: Zakaria Safri
Original Work: All code and concepts are original implementations
Based On: ICT (Inner Circle Trader) educational concepts
License: © 2024 Zakaria Safri - Personal Use Only
═══════════════════════════════════════════════════════════════════════════════
⚖️ DISCLAIMER
═══════════════════════════════════════════════════════════════════════════════
This indicator is for educational and informational purposes only. It does not
constitute financial advice. Trading involves substantial risk of loss. Past
performance does not guarantee future results. Always conduct your own research
and consult with a licensed financial advisor before making trading decisions.
The author is not responsible for any losses incurred from using this indicator.
═══════════════════════════════════════════════════════════════════════════════
If you find this indicator helpful, please:
👍 Like and favorite
⭐ Leave a review
📢 Share with other traders
💬 Comment with feedback or suggestions
Happy Trading! 📈

Real Relative Strength Breakout & BreakdownReal Relative Strength Breakout & Breakdown Indicator
What It Does
Identifies high-probability trading setups by combining:
Technical Breakouts/Breakdowns - Price breaking support/resistance zones
Real Relative Strength (RRS) - Volatility-adjusted performance vs benchmark (SPY)
Key Insight: The strongest signals occur when price action contradicts market direction—breakouts during market weakness or breakdowns during market strength show exceptional buying/selling pressure.
Real Relative Strength (RRS) Calculation
RRS measures outperformance/underperformance on a volatility-adjusted basis:
Power Index = (Benchmark Price Move) / (Benchmark ATR)
RRS = (Stock Price Move - Power Index × Stock ATR) / Stock ATR
RRS (smoothed) = 3-period SMA of RRS
Interpretation:
RRS > 0 = Relative Strength (outperforming)
RRS < 0 = Relative Weakness (underperforming)
Signal Types
🟢 Large Green Triangle (Premium Long)
Condition: Breakout + RRS > 0
Meaning: Stock breaking resistance WHILE outperforming benchmark
Best when: Market is weak but stock breaks out anyway = exceptional strength
Use: High-conviction long entries
🔵 Small Blue Triangle (Standard Breakout)
Condition: Breakout + RRS ≤ 0
Meaning: Breaking resistance but underperforming benchmark
Typical: "Rising tide lifts all boats" scenario during market rally
Use: Lower conviction—may just be following market
🟠 Large Orange Triangle (Premium Short)
Condition: Breakdown + RRS < 0
Meaning: Stock breaking support WHILE underperforming benchmark
Best when: Market is strong but stock breaks down anyway = severe weakness
Use: High-conviction short entries
🔴 Small Red Triangle (Standard Breakdown)
Condition: Breakdown + RRS ≥ 0
Meaning: Breaking support but outperforming benchmark
Typical: Stock falling less than market during selloff
Use: Lower conviction—may recover when market does
Why Large Triangles Matter
Large signals show divergence = genuine institutional flow:
Stock breaking out while market falls → Aggressive buying despite headwinds
Stock breaking down while market rallies → Aggressive selling despite tailwinds
These setups reveal where real conviction lies, not just momentum-following behavior.
Quick Settings
RRS: 12-period lookback, 3-bar smoothing, vs SPY
Breakouts: 5-period pivots, 200-bar lookback, 3% zone width, 2 minimum tests

nadia
Gold ramon strategy based on 50 candles and atr of 12
You enter the maximum of 50 candles once the most bearish starts to rise, we expect 10 candles, if you don't go up in 10 candles, you don't enter, if you go up before 10 candles, you enter.
When is TP? Enough with 5 candles
The temporality is 1 hour. It can be adjusted to 1 minute temporality for scalping.
It is never lost, because it always exceeds the previous maximums.

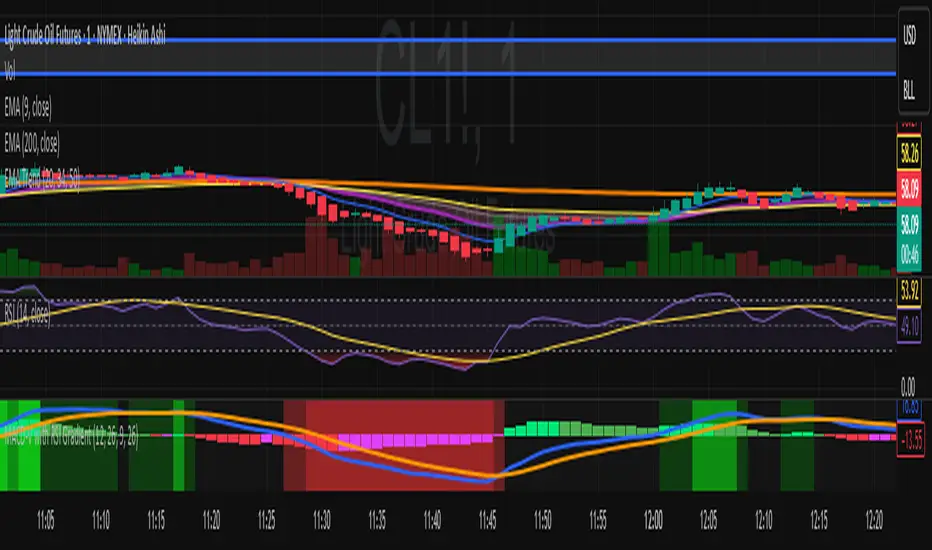
MACD-V with RSI Gradient## Overview
MACD-V is a volatility-adjusted momentum indicator that normalizes MACD using ATR. This version adds a dynamic RSI-based background gradient to highlight momentum zones visually.
## Features
- **MACD-V Line**: EMA-based momentum normalized by ATR
- **Signal Line**: EMA of MACD-V
- **Histogram**: Color-coded based on slope and polarity
- **RSI Gradient Background**: Shading from bright green (RSI > 75) to bright red (RSI < 30), with intermediate tones for momentum context
## Use Case
Designed for 30-minute oil futures charts, this indicator helps identify:
- Trend strength and reversals
- Momentum zones using RSI shading
- Pullback opportunities and exhaustion zones
## Inputs
- Fast EMA (default: 12)
- Slow EMA (default: 26)
- Signal EMA (default: 9)
- ATR Length (default: 26)
## Notes
- RSI shading is purely visual—no alerts are wired in yet
- Histogram renders behind MACD-V and Signal lines for clarity
- Colors are tuned for dark charts
## Credits
The MACD-v is an indicator created in 2015 by Alex Spiroglou
and presented to the public in 2022
as a paper called: "𝗠𝗔𝗖𝗗-𝘃: 𝗩𝗼𝗹𝗮𝘁𝗶𝗹𝗶𝘁𝘆 𝗡𝗼𝗿𝗺𝗮𝗹𝗶𝘀𝗲𝗱 𝗠𝗼𝗺𝗲𝗻𝘁𝘂𝗺"
It received the following Awards:
1. “𝐅𝐨𝐮𝐧𝐝𝐞𝐫𝐬 𝐀𝐰𝐚𝐫𝐝” (2022),
for advances in Active Investment Management
from the National Association of Active Investment Managers (NAAIM)
2. “𝐂𝐡𝐚𝐫𝐥𝐞𝐬 𝐇. 𝐃𝐨𝐰 𝐀𝐰𝐚𝐫𝐝” (2022)
for outstanding research in Technical Analysis,
from the Chartered Market Technicians Association (CMTA)
The RSI Gradient was my idea, but quite frankly, if I go looking around I suppose I'll find that others had the same idea.
This is the first time I've ever published any code, so if I stepped on anyone's toes. I'm sorry.

MACD-V with RSI Gradient## Overview
MACD-V is a volatility-adjusted momentum indicator that normalizes MACD using ATR. This version adds a dynamic RSI-based background gradient to highlight momentum zones visually.
## Features
- **MACD-V Line**: EMA-based momentum normalized by ATR
- **Signal Line**: EMA of MACD-V
- **Histogram**: Color-coded based on slope and polarity
- **RSI Gradient Background**: Shading from bright green (RSI > 75) to bright red (RSI < 30), with intermediate tones for momentum context
## Use Case
Designed for 30-minute oil futures charts, this indicator helps identify:
- Trend strength and reversals
- Momentum zones using RSI shading
- Pullback opportunities and exhaustion zones
## Inputs
- Fast EMA (default: 12)
- Slow EMA (default: 26)
- Signal EMA (default: 9)
- ATR Length (default: 26)
## Notes
- RSI shading is purely visual—no alerts are wired in yet
- Histogram renders behind MACD-V and Signal lines for clarity
- Colors are tuned for dark charts
## Credits
Developed by Mark (SylvaRocks), optimized for tactical clarity and scalping precision.
REMS Synergy OverlayThis 3rd generation REMS indicator builds upon the foundations assessing the relationships between RSI, EMAs, MACDs, and Stochastic RSI across multiple timeframes. Designed to help traders identify less frequent, but high probability entries across 2 time frames. Uses 3 levels of confluence indicators for both long and short moves.
Confluence Level 1 (Highest Conviction):
Evaluates selected criteria across both timeframes. All selected criteria must be in confluence to trigger signal.
Confluence Level 2 (Moderate Conviction):
Selected criteria can be selected by each timeframe individually. All selected criteria must be in confluence to trigger signal.
Confluence Level 3 (Lower/supportive confluence):
Of the selected criteria, this level can evaluate a set number of conditions that must be met. Number of conditions is user-defined.
Includes VWAP and 4 EMAs as optional visual representations.
Includes 'Enhanced Candles' than can colour code candlesticks for better visual identification. (off by default)
Originally designed with 5 minute and 2 minute timeframes in mind, and pairs well with REMS First Strike and/or REMS Snap Shot indicators.
Values coded below:
RSI
-Primary: Length = 14, Smoothing = 20 (via SMA)
-Secondary: Length = 7, Smoothing = 20 (via SMA)
Stochastic RSI
Primary:
-RSI Length = 14
-Stochastic Length = 8
-%K = 3, %D = 3
Secondary:
-RSI Length = 7
-Stochastic Length = 7
-%K = 3, %D = 2
MACD - applied to both timeframes
-Fast = 12, Slow = 26, Signal = 9

True Single Line Fusion [by TitikSona]🧠 Full Description
True Single Line Fusion by TitikSona is an open-source oscillator that unifies Fast Stochastic, Slow Stochastic, and RSI into a single smooth momentum line.
It simplifies multi-oscillator analysis into one clear visual — helping traders recognize potential momentum shifts, exhaustion, and reversal zones.
⚙️ Core Logic
The indicator calculates:
Fast Stochastic (12,3,3) → short-term swing sensitivity
Slow Stochastic (100,8,8) → broad trend context
RSI (26) → overall strength and directional bias
All three are normalized (0–100) and averaged to form the Fusion Line, creating a single unified momentum curve.
A Signal Line (SMA-9) and Histogram are added to highlight short-term acceleration or deceleration.
Formula: Fusion = (FastK + SlowK + RSI) / 3
🔍 Interpretation
Fusion Line rising → momentum strengthening upward
Fusion Line falling → momentum weakening
Histogram color (green/red) shows the direction and intensity of the move
Background highlights identify potential extremes:
🟩 Green = potential oversold region
🟥 Red = potential overbought region
💡 How to Use
Works on any symbol and timeframe.
Use the Fusion Line’s direction and slope as momentum context, not as direct buy/sell signals.
Combine with price structure, support/resistance, or volume analysis to confirm potential reversals.
Example:
Fusion Line turning upward from green zone → possible bullish momentum shift
Fusion Line turning downward from red zone → possible bearish exhaustion
📘 Notes
Ideal for identifying turning points in ranging or consolidating markets.
Does not generate automated signals or predictions.
Open-source for learning, modification, and educational use.
Designed for clarity, low lag, and clean visualization.
🧩 Developed and shared by TitikSona — made to unify oscillators into one adaptive momentum tool.

Seasonality Heatmap [QuantAlgo]🟢 Overview
The Seasonality Heatmap analyzes years of historical data to reveal which months and weekdays have consistently produced gains or losses, displaying results through color-coded tables with statistical metrics like consistency scores (1-10 rating) and positive occurrence rates. By calculating average returns for each calendar month and day-of-week combination, it identifies recognizable seasonal patterns (such as which months or weekdays tend to rally versus decline) and synthesizes this into actionable buy low/sell high timing possibilities for strategic entries and exits. This helps traders and investors spot high-probability seasonal windows where assets have historically shown strength or weakness, enabling them to align positions with recurring bull and bear market patterns.
🟢 How It Works
1. Monthly Heatmap
How % Return is Calculated:
The indicator fetches monthly closing prices (or Open/High/Low based on user selection) and calculates the percentage change from the previous month:
(Current Month Price - Previous Month Price) / Previous Month Price × 100
Each cell in the heatmap represents one month's return in a specific year, creating a multi-year historical view
Colors indicate performance intensity: greener/brighter shades for higher positive returns, redder/brighter shades for larger negative returns
What Averages Mean:
The "Avg %" row displays the arithmetic mean of all historical returns for each calendar month (e.g., averaging all Januaries together, all Februaries together, etc.)
This metric identifies historically recurring patterns by showing which months have tended to rise or fall on average
Positive averages indicate months that have typically trended upward; negative averages indicate historically weaker months
Example: If April shows +18.56% average, it means April has averaged a 18.56% gain across all years analyzed
What Months Up % Mean:
Shows the percentage of historical occurrences where that month had a positive return (closed higher than the previous month)
Calculated as:
(Number of Months with Positive Returns / Total Months) × 100
Values above 50% indicate the month has been positive more often than negative; below 50% indicates more frequent negative months
Example: If October shows "64%", then 64% of all historical Octobers had positive returns
What Consistency Score Means:
A 1-10 rating that measures how predictable and stable a month's returns have been
Calculated using the coefficient of variation (standard deviation / mean) - lower variation = higher consistency
High scores (8-10, green): The month has shown relatively stable behavior with similar outcomes year-to-year
Medium scores (5-7, gray): Moderate consistency with some variability
Low scores (1-4, red): High variability with unpredictable behavior across different years
Example: A consistency score of 8/10 indicates the month has exhibited recognizable patterns with relatively low deviation
What Best Means:
Shows the highest percentage return achieved for that specific month, along with the year it occurred
Reveals the maximum observed upside and identifies outlier years with exceptional performance
Useful for understanding the range of possible outcomes beyond the average
Example: "Best: 2016: +131.90%" means the strongest January in the dataset was in 2016 with an 131.90% gain
What Worst Means:
Shows the most negative percentage return for that specific month, along with the year it occurred
Reveals maximum observed downside and helps understand the range of historical outcomes
Important for risk assessment even in months with positive averages
Example: "Worst: 2022: -26.86%" means the weakest January in the dataset was in 2022 with a 26.86% loss
2. Day-of-Week Heatmap
How % Return is Calculated:
Calculates the percentage change from the previous day's close to the current day's price (based on user's price source selection)
Returns are aggregated by day of the week within each calendar month (e.g., all Mondays in January, all Tuesdays in January, etc.)
Each cell shows the average performance for that specific day-month combination across all historical data
Formula:
(Current Day Price - Previous Day Close) / Previous Day Close × 100
What Averages Mean:
The "Avg %" row at the bottom aggregates all months together to show the overall average return for each weekday
Identifies broad weekly patterns across the entire dataset
Calculated by summing all daily returns for that weekday across all months and dividing by total observations
Example: If Monday shows +0.04%, Mondays have averaged a 0.04% change across all months in the dataset
What Days Up % Mean:
Shows the percentage of historical occurrences where that weekday had a positive return
Calculated as:
(Number of Positive Days / Total Days Observed) × 100
Values above 50% indicate the day has been positive more often than negative; below 50% indicates more frequent negative days
Example: If Fridays show "54%", then 54% of all Fridays in the dataset had positive returns
What Consistency Score Means:
A 1-10 rating measuring how stable that weekday's performance has been across different months
Based on the coefficient of variation of daily returns for that weekday across all 12 months
High scores (8-10, green): The weekday has shown relatively consistent behavior month-to-month
Medium scores (5-7, gray): Moderate consistency with some month-to-month variation
Low scores (1-4, red): High variability across months, with behavior differing significantly by calendar month
Example: A consistency score of 7/10 for Wednesdays means they have performed with moderate consistency throughout the year
What Best Means:
Shows which calendar month had the strongest average performance for that specific weekday
Identifies favorable day-month combinations based on historical data
Format shows the month abbreviation and the average return achieved
Example: "Best: Oct: +0.20%" means Mondays averaged +0.20% during October months in the dataset
What Worst Means:
Shows which calendar month had the weakest average performance for that specific weekday
Identifies historically challenging day-month combinations
Useful for understanding which month-weekday pairings have shown weaker performance
Example: "Worst: Sep: -0.35%" means Tuesdays averaged -0.35% during September months in the dataset
3. Optimal Timing Table/Summary Table
→ Best Month to BUY: Identifies the month with the lowest average return (most negative or least positive historically), representing periods where prices have historically been relatively lower
Based on the observation that buying during historically weaker months may position for subsequent recovery
Shows the month name, its average return, and color-coded performance
Example: If May shows -0.86% as "Best Month to BUY", it means May has historically averaged -0.86% in the analyzed period
→ Best Month to SELL: Identifies the month with the highest average return (most positive historically), representing periods where prices have historically been relatively higher
Based on historical strength patterns in that month
Example: If July shows +1.42% as "Best Month to SELL", it means July has historically averaged +1.42% gains
→ 2nd Best Month to BUY: The second-lowest performing month based on average returns
Provides an alternative timing option based on historical patterns
Offers flexibility for staged entries or when the primary month doesn't align with strategy
Example: Identifies the next-most favorable historical buying period
→ 2nd Best Month to SELL: The second-highest performing month based on average returns
Provides an alternative exit timing based on historical data
Useful for staged profit-taking or multiple exit opportunities
Identifies the secondary historical strength period
Note: The same logic applies to "Best Day to BUY/SELL" and "2nd Best Day to BUY/SELL" rows, which identify weekdays based on average daily performance across all months. Days with lowest averages are marked as buying opportunities (historically weaker days), while days with highest averages are marked for selling (historically stronger days).
🟢 Examples
Example 1: NVIDIA NASDAQ:NVDA - Strong May Pattern with High Consistency
Analyzing NVIDIA from 2015 onwards, the Monthly Heatmap reveals May averaging +15.84% with 82% of months being positive and a consistency score of 8/10 (green). December shows -1.69% average with only 40% of months positive and a low 1/10 consistency score (red). The Optimal Timing table identifies December as "Best Month to BUY" and May as "Best Month to SELL." A trader recognizes this high-probability May strength pattern and considers entering positions in late December when prices have historically been weaker, then taking profits in May when the seasonal tailwind typically peaks. The high consistency score in May (8/10) provides additional confidence that this pattern has been relatively stable year-over-year.
Example 2: Crypto Market Cap CRYPTOCAP:TOTALES - October Rally Pattern
An investor examining total crypto market capitalization notices September averaging -2.42% with 45% of months positive and 5/10 consistency, while October shows a dramatic shift with +16.69% average, 90% of months positive, and an exceptional 9/10 consistency score (blue). The Day-of-Week heatmap reveals Mondays averaging +0.40% with 54% positive days and 9/10 consistency (blue), while Thursdays show only +0.08% with 1/10 consistency (yellow). The investor uses this multi-layered analysis to develop a strategy: enter crypto positions on Thursdays during late September (combining the historically weak month with the less consistent weekday), then hold through October's historically strong period, considering exits on Mondays when intraweek strength has been most consistent.
Example 3: Solana BINANCE:SOLUSDT - Extreme January Seasonality
A cryptocurrency trader analyzing Solana observes an extraordinary January pattern: +59.57% average return with 60% of months positive and 8/10 consistency (teal), while May shows -9.75% average with only 33% of months positive and 6/10 consistency. August also displays strength at +59.50% average with 7/10 consistency. The Optimal Timing table confirms May as "Best Month to BUY" and January as "Best Month to SELL." The Day-of-Week data shows Sundays averaging +0.77% with 8/10 consistency (teal). The trader develops a seasonal rotation strategy: accumulate SOL positions during May weakness, hold through the historically strong January period (which has shown this extreme pattern with reasonable consistency), and specifically target Sunday exits when the weekday data shows the most recognizable strength pattern.

CB Charts - GEX NQ/MNQ
Last Updated: 2025-10-14 12:59:34 PST
*DISCLAIMER: Only intended for NQZ2025/MNQZ2025 charts.
This indicator plots horizontal levels based on batched GEX levels for NQZ2025/MNQZ2025. The batched data is derived from contracts expiring: 0DTE, 1DTE, EoW, EoM, Next Week, Next Month and 3-months out. Labels are available for a high-level view of which levels are which. Hovering (or long-pressing on mobile TV) over the labels will display the nominal values and Rank. This script is manually updated and may not be always updated.
When and what to use:
- Most respected levels come from 1DTE, EoW and EoM.
- 0DTE is included for when this script becomes intraday updated. (CURRENTLY NOT UPDATED INTRADAY)
- Next Week setting is best used only for Friday and Sunday trading
- Next Month setting is best for weeks close to the end of the current month
Powered by the Camels of Wallstreet

RTACoreLibrary "RTACore"
Advanced multi-timeframe technical analysis framework for Pine Script
@author WavesUnchained
@build 2025-10-14 22:41:47
newFloatResult(value, context)
Create a successful Result with float value
Parameters:
value (float)
context (string)
newStringResult(value, context)
Create a successful Result with string value
Parameters:
value (string)
context (string)
newBoolResult(value, context)
Create a successful Result with boolean value
Parameters:
value (bool)
context (string)
newErrorResult(errorCode, errorMessage, floatFallback, stringFallback, boolFallback, context)
Create an error Result with fallback values
Parameters:
errorCode (string)
errorMessage (string)
floatFallback (float)
stringFallback (string)
boolFallback (bool)
context (string)
addResultTag(result, tag)
Add a tag to Result
Parameters:
result (Result)
tag (string)
newSignalResult(signalStrength, signalType)
Create a signal Result with trading-specific tags
Parameters:
signalStrength (float)
signalType (string)
newIndicatorResult(value, indicatorName)
Create an indicator calculation Result with indicator tag
Parameters:
value (float)
indicatorName (string)
newTimeframeResult(value, timeframe, context)
Create a timeframe-specific Result
Parameters:
value (float)
timeframe (string)
context (string)
newConfluenceResult(confluenceScore, confidenceLevel)
Create a confluence Result with confidence level
Parameters:
confluenceScore (float)
confidenceLevel (string)
newValidationResult(context)
Create a new validation result (starts as valid)
Parameters:
context (string)
newValidationSuccess(context)
Create a successful validation result
Parameters:
context (string)
newValidationFailure(errors, context)
Create a failed validation result with errors
Parameters:
errors (array)
context (string)
addValidationError(result, field, error)
Add an error to validation result
Parameters:
result (ValidationResult)
field (string)
error (string)
addValidationWarning(result, field, warning)
Add a warning to validation result
Parameters:
result (ValidationResult)
field (string)
warning (string)
addValidationCorrection(result, correction)
Add a correction to validation result
Parameters:
result (ValidationResult)
correction (string)
setValidationMode(result, mode)
Set validation mode
Parameters:
result (ValidationResult)
mode (string)
getValidationMode(result)
Get validation mode
Parameters:
result (ValidationResult)
incrementValidatedFields(result)
Increment validated fields counter
Parameters:
result (ValidationResult)
setValidationTotalFields(result, total)
Set total fields for validation
Parameters:
result (ValidationResult)
total (int)
calculateValidationScore(result)
Calculate and update validation score based on errors/warnings
Parameters:
result (ValidationResult)
newPerformanceProfile(functionName)
Create a new performance profile
Parameters:
functionName (string)
startTiming(profile)
Start timing a performance profile (simple)
Parameters:
profile (PerformanceProfile)
endTiming(profile, hadError)
End timing and update performance profile
Parameters:
profile (PerformanceProfile)
hadError (bool)
updateMemoryEstimate(profile, arrayElements)
Set estimated memory usage (array elements)
Parameters:
profile (PerformanceProfile)
arrayElements (int)
newHealthyStatus()
Create a new healthy status
setComponentHealth(status, component, isOK, message)
Set component health status
Parameters:
status (HealthStatus)
component (string)
isOK (bool)
message (string)
isHealthyOverall(status)
Quick health check - are all components OK?
Parameters:
status (HealthStatus)
getHealthSummary(status)
Get simple health summary
Parameters:
status (HealthStatus)
hasValidFloat(result)
Check if Result contains a valid float value
Parameters:
result (Result)
hasValidString(result)
Check if Result contains a valid string value
Parameters:
result (Result)
getFloat(result, fallback)
Get float value from Result with fallback
Parameters:
result (Result)
fallback (float)
getString(result, fallback)
Get string value from Result with fallback
Parameters:
result (Result)
fallback (string)
getBool(result, fallback)
Get boolean value from Result with fallback
Parameters:
result (Result)
fallback (bool)
hasResultTag(result, tag)
Check if Result has specific tag
Parameters:
result (Result)
tag (string)
getResultTags(result)
Get all tags from Result
Parameters:
result (Result)
setResultContext(result, context)
Set operation context for Result
Parameters:
result (Result)
context (string)
filterResultsByTag(results, tag)
Filter Results by tag (utility for arrays of Results)
Parameters:
results (array)
tag (string)
getAllResultTags(results)
Get all unique tags from array of Results
Parameters:
results (array)
newDefaultAnalysisConfig()
Create default analysis configuration
newAggressiveAnalysisConfig()
Create aggressive trading configuration
newConservativeAnalysisConfig()
Create conservative trading configuration
newDefaultTimeframeConfig()
Create default timeframe configuration
newIntradayTimeframeConfig()
Create intraday timeframe configuration
newSwingTimeframeConfig()
Create swing trading timeframe configuration
getConfigSummary(config)
Get configuration summary string
Parameters:
config (AnalysisConfig)
cloneAnalysisConfig(source)
Clone analysis configuration
Parameters:
source (AnalysisConfig)
newGenericAnalysis(analysisType, timeframe)
Create a new generic analysis result
Parameters:
analysisType (string)
timeframe (string)
newConsensusData()
Create empty consensus data
newNeutralSignal(reason)
Create a neutral signal result
Parameters:
reason (string)
newBuySignal(score, confidence, reason)
Create a buy signal result
Parameters:
score (float)
confidence (float)
reason (string)
newSellSignal(score, confidence, reason)
Create a sell signal result
Parameters:
score (float)
confidence (float)
reason (string)
newMultiTimeframeResult(config, tfConfig)
Create new multi-timeframe result
Parameters:
config (AnalysisConfig)
tfConfig (TimeframeConfig)
getAnalysisAction(analysis)
Get analysis action string
Parameters:
analysis (GenericAnalysis)
isBullish(analysis)
Check if analysis is bullish
Parameters:
analysis (GenericAnalysis)
isBearish(analysis)
Check if analysis is bearish
Parameters:
analysis (GenericAnalysis)
getSignalSummary(signal)
Get signal summary string
Parameters:
signal (SignalResult)
hasStrongConsensus(consensus)
Check if consensus is strong
Parameters:
consensus (ConsensusData)
getConsensusSummary(consensus)
Get consensus summary
Parameters:
consensus (ConsensusData)
isActionableSignal(signal)
Check if signal is actionable
Parameters:
signal (SignalResult)
getSignalColor(signal)
Get signal color for UI display
Parameters:
signal (SignalResult)
validateAnalysisConfig(config)
Validate analysis configuration
Parameters:
config (AnalysisConfig)
validateTimeframeConfig(config)
Validate timeframe configuration
Parameters:
config (TimeframeConfig)
validatePriceData(prices)
Validate price data array
Parameters:
prices (array)
sanitizeFloat(value, minVal, maxVal, defaultVal)
Sanitize numeric input
Parameters:
value (float)
minVal (float)
maxVal (float)
defaultVal (float)
sanitizeInt(value, minVal, maxVal, defaultVal)
Sanitize integer input
Parameters:
value (int)
minVal (int)
maxVal (int)
defaultVal (int)
sanitizeFloatArray(arr)
Sanitize array by removing invalid values
Parameters:
arr (array)
logError(message)
Log error message
Parameters:
message (string)
logWarning(message)
Log warning message
Parameters:
message (string)
safeExecute(operationName, condition)
Safe execute wrapper
Parameters:
operationName (string)
condition (bool)
shouldAllowOperation(errorCount, maxErrors)
Circuit breaker pattern
Parameters:
errorCount (int)
maxErrors (int)
retryOperation(maxRetries)
Retry mechanism
Parameters:
maxRetries (int)
atrDistance(value1, value2, atr)
Calculate ATR-normalized distance between two values
Parameters:
value1 (float)
value2 (float)
atr (float)
atrDistance(value, reference, atrLength)
Calculate ATR-normalized distance between values
Parameters:
value (float)
reference (float)
atrLength (simple int)
percentDistance(value1, value2)
Calculate percentage-based distance between two values
Parameters:
value1 (float)
value2 (float)
withinATRTolerance(value, reference, atr, multiplier)
Check if value is within ATR-based tolerance of reference
Parameters:
value (float)
reference (float)
atr (float)
multiplier (float)
withinATRTolerance(value, reference, multiplier)
Check if value is within ATR-based tolerance of reference
Parameters:
value (float)
reference (float)
multiplier (float)
withinPercentTolerance(value, reference, percentTolerance)
Check if value is within percentage tolerance of reference
Parameters:
value (float)
reference (float)
percentTolerance (float)
proximityScore(value, reference, maxDistance)
Get proximity score (0-1, where 1 = very close)
Parameters:
value (float)
reference (float)
maxDistance (float)
sortArrayByValue(values, sortOrder)
Efficient array sorting using Pine Script native sort
Note: Replaces inefficient bubble sort implementations found in modules
Parameters:
values (array)
sortOrder (string)
safeArrayAverage(values)
Safe array average with null handling
Parameters:
values (array)
formatTableHeader(title, width)
Create formatted header for display tables
Parameters:
title (string)
width (int)
formatTableRow(key, value, width)
Format table row with key-value pair
Parameters:
key (string)
value (string)
width (int)
formatTableFooter(width)
Close table formatting
Parameters:
width (int)
truncateText(txt, maxLength, suffix)
Truncate text to specified length
Parameters:
txt (string)
maxLength (int)
suffix (string)
padText(txt, width, padChar, align)
Pad text to specified width
Parameters:
txt (string)
width (int)
padChar (string)
align (string)
titleCase(txt)
Convert text to title case
Parameters:
txt (string)
joinStrings(strings, separator)
Join array of strings with separator
Parameters:
strings (array)
separator (string)
formatTimestamp(timestamp, format)
Format timestamp to readable date/time
Parameters:
timestamp (int)
format (string)
evictLRU(cache)
Evict least recently used entry
Parameters:
cache (CacheManager)
newRiskAssessment()
Create a default risk assessment
calculateRiskAssessment(signal, volatility, volumeLevel)
Calculate comprehensive risk assessment
Parameters:
signal (SignalResult)
volatility (float)
volumeLevel (float)
newPositionData()
Create new empty position data
getConservativeStrategy()
Create conservative strategy template
getAggressiveStrategy()
Create aggressive strategy template
newDefaultStrategy()
Create default balanced strategy template
getStandardATR()
Get standard ATR(14) - cached per bar
getATR(length)
Get custom ATR with specified length
Parameters:
length (simple int)
getATRTolerance(multiplier)
Get ATR-based tolerance for distance calculations
Parameters:
multiplier (float)
getStandardVolumeAverage()
Get standard volume average SMA(20) - cached per bar
getVolumeAverage(length)
Get custom volume average
Parameters:
length (int)
getVolumeRatio()
Get volume ratio (current vs average)
getVolumeConfirmation(threshold)
Get volume confirmation (above threshold)
Parameters:
threshold (float)
getStandardEMAs()
Get standard EMAs (21, 50, 200) - cached per bar
getEMA21()
Get individual standard EMAs
getEMA50()
getEMA200()
getEMATrendAlignment()
Get EMA trend alignment score
getStandardRSI()
Get standard RSI(14) - cached per bar
getRSILevels(overbought, oversold)
Get RSI with overbought/oversold levels
Parameters:
overbought (float)
oversold (float)
getStandardMACD()
Get standard MACD (12, 26, 9) - cached per bar
getMACDSignal()
Get MACD trend signal
getMomentumScore()
Get comprehensive momentum score
getTrendStrength()
Get trend strength (0-100)
getIndicatorSummary()
Get indicator calculation summary (for debugging)
newZoneDetectionConfig()
Create default zone configuration
newZoneDetection(upperBoundary, lowerBoundary, creationBar, zoneType)
Create new zone
Parameters:
upperBoundary (float)
lowerBoundary (float)
creationBar (int)
zoneType (string)
calculateZoneOverlap(zone1Upper, zone1Lower, zone2Upper, zone2Lower)
Calculate zone overlap ratio
Parameters:
zone1Upper (float)
zone1Lower (float)
zone2Upper (float)
zone2Lower (float)
isPriceTouchingZone(zone, currentPrice, touchTolerance)
Check if price is touching zone
Parameters:
zone (ZoneDetection)
currentPrice (float)
touchTolerance (float)
getZonesInRange(zones, minPrice, maxPrice)
Get zones within price range
Parameters:
zones (array)
minPrice (float)
maxPrice (float)
getNearestZones(zones, currentPrice)
Get nearest support and resistance zones
Parameters:
zones (array)
currentPrice (float)
processZoneDetection(zones, config)
Complete zone detection and management system
Parameters:
zones (array)
config (ZoneDetectionConfig)
processZoneDetectionEngine(zones, config)
Parameters:
zones (array)
config (ZoneDetectionConfig)
newChannelConfig()
calcKeltnerChannel(config)
Parameters:
config (ChannelConfig)
checkKeltnerTouch(upper, lower)
Parameters:
upper (float)
lower (float)
getKeltnerDepth(basis, upper, lower)
Parameters:
basis (float)
upper (float)
lower (float)
checkKeltnerBreakout(upper, lower)
Parameters:
upper (float)
lower (float)
calcDonchianChannel(config)
Parameters:
config (ChannelConfig)
checkDonchianTouch(upper, lower)
Parameters:
upper (float)
lower (float)
checkDonchianReentry(upper, lower)
Parameters:
upper (float)
lower (float)
getDonchianWidth(upper, lower)
Parameters:
upper (float)
lower (float)
calcBollingerBands(config)
Parameters:
config (ChannelConfig)
calcSqueezeRatio(bbStdev, kcMultiplier, kcAtr)
Parameters:
bbStdev (float)
kcMultiplier (float)
kcAtr (float)
detectSqueezeState(squeezeRatio)
Parameters:
squeezeRatio (float)
detectSqueezeBreak(squeezeRatio, kcUpper, kcLower)
Parameters:
squeezeRatio (float)
kcUpper (float)
kcLower (float)
getSqueezeIntensity(squeezeRatio)
Parameters:
squeezeRatio (float)
processChannelDetection(config)
Parameters:
config (ChannelConfig)
detectChannelSignals(state)
Parameters:
state (ChannelState)
detectQualityZones(state)
Parameters:
state (ChannelState)
getChannelSignalText(state)
Parameters:
state (ChannelState)
analyzeChannelTrend(state)
Parameters:
state (ChannelState)
getChannelConfluence(state)
Parameters:
state (ChannelState)
newVwapConfig()
newVwapAnchors()
calcSessionVwap()
getPreviousSessionVwap(sessionVwap)
Parameters:
sessionVwap (float)
updateVwapAnchors(anchors, config)
Parameters:
anchors (VwapAnchors)
config (VwapConfig)
calcAnchoredVwap(anchors, isHigh)
Parameters:
anchors (VwapAnchors)
isHigh (bool)
detectPriceCrosses(sessionVwap)
Parameters:
sessionVwap (float)
detectStructureCrosses(sessionVwap, anchoredHigh, anchoredLow)
Parameters:
sessionVwap (float)
anchoredHigh (float)
anchoredLow (float)
detectVwapCluster(sessionVwap, anchoredHigh, anchoredLow, config)
Parameters:
sessionVwap (float)
anchoredHigh (float)
anchoredLow (float)
config (VwapConfig)
canShowSignal(anchors, config, signalType)
Parameters:
anchors (VwapAnchors)
config (VwapConfig)
signalType (string)
updateSignalThrottle(anchors, signalType)
Parameters:
anchors (VwapAnchors)
signalType (string)
calcCrossStrength(sessionVwap, isPriceCross)
Parameters:
sessionVwap (float)
isPriceCross (bool)
calcClusterStrength(vwapsInCluster, priceInCluster, tolerance)
Parameters:
vwapsInCluster (bool)
priceInCluster (bool)
tolerance (float)
calcStructureStrength(sessionVwap, anchoredHigh, anchoredLow)
Parameters:
sessionVwap (float)
anchoredHigh (float)
anchoredLow (float)
analyzeVwapTrend(sessionVwap)
Parameters:
sessionVwap (float)
processVwapDetection(anchors, config)
Parameters:
anchors (VwapAnchors)
config (VwapConfig)
generateVwapSignals(state)
Parameters:
state (VwapState)
getVwapBias(state)
Parameters:
state (VwapState)
getVwapConfluence(state)
Parameters:
state (VwapState)
newZoneConfig()
newZoneState()
stringToFloats(s)
Parameters:
s (string)
calculateBias(config)
Parameters:
config (ZoneConfig)
createZone(top, bottom, isBull, isHTF)
Parameters:
top (float)
bottom (float)
isBull (bool)
isHTF (bool)
updateZoneStatus(zone)
Parameters:
zone (Zone)
detectFVGOverlap(zone)
Parameters:
zone (Zone)
scoreZone(zone, config)
Parameters:
zone (Zone)
config (ZoneConfig)
sortAndTrimZones(zones, config)
Parameters:
zones (array)
config (ZoneConfig)
adjustZoneVisibility(zones, config)
Parameters:
zones (array)
config (ZoneConfig)
calculateTargetsATR(base, stepsString, atrLength)
Parameters:
base (float)
stepsString (string)
atrLength (simple int)
calculateTargetsSigma(base, stepsString, sigmaLength)
Parameters:
base (float)
stepsString (string)
sigmaLength (int)
calculateTargetsLiquidity(isLong, config)
Parameters:
isLong (bool)
config (ZoneConfig)
detectZoneSignals(zones, bias, config)
Parameters:
zones (array)
bias (int)
config (ZoneConfig)
processZoneManagement(state, config)
Parameters:
state (ZoneState)
config (ZoneConfig)
findNearestZones(state)
Parameters:
state (ZoneState)
newVolumeConfig()
newVolumeState()
getPriceSource(config)
Parameters:
config (VolumeConfig)
isInSession(config)
Parameters:
config (VolumeConfig)
isNewSession(config)
Parameters:
config (VolumeConfig)
calculateWindow(config)
Parameters:
config (VolumeConfig)
calculateProfile(config, windowStart, windowLength)
Parameters:
config (VolumeConfig)
windowStart (int)
windowLength (int)
detectVolumeNodes(binVolumes, binPrices, totalVolume)
Parameters:
binVolumes (array)
binPrices (array)
totalVolume (float)
calculateVolumeChoppiness(config)
Calculate choppiness index for volume profile
Parameters:
config (VolumeConfig)
detectMarketRegime(state, config)
Detect market regime based on multiple factors
Parameters:
state (VolumeState)
config (VolumeConfig)
calculateAdaptiveParameters(state, config)
Calculate adaptive volume profile parameters
Parameters:
state (VolumeState)
config (VolumeConfig)
updateMarketConditions(state, config)
Update volume state with market conditions
Parameters:
state (VolumeState)
config (VolumeConfig)
applyAdaptiveConfig(config, state)
Apply adaptive parameters to profile calculation
Parameters:
config (VolumeConfig)
state (VolumeState)
getHTFPivots(config)
Parameters:
config (VolumeConfig)
checkPivotConfluence(price, config, pivotHigh1, pivotLow1, pivotHigh2, pivotLow2)
Parameters:
price (float)
config (VolumeConfig)
pivotHigh1 (float)
pivotLow1 (float)
pivotHigh2 (float)
pivotLow2 (float)
calculateMOST()
Calculate MOST (Moving Stop) indicator
calculateTrendFilters(config)
Parameters:
config (VolumeConfig)
findNearestNodes(hvnNodes, lvnNodes)
Parameters:
hvnNodes (array)
lvnNodes (array)
detectVolumeSignals(config, profile, trendBullish, htfConfluence)
Parameters:
config (VolumeConfig)
profile (VolumeProfile)
trendBullish (bool)
htfConfluence (bool)
calculateVolumeScore(profile, trendBullish)
Parameters:
profile (VolumeProfile)
trendBullish (bool)
processVolumeProfile(state, config)
Parameters:
state (VolumeState)
config (VolumeConfig)
newHTFConfig()
newHTFStackState()
getOptimalTimeframes(chartTF)
Parameters:
chartTF (string)
calculateChoppiness(length)
Parameters:
length (int)
detectTrendEMA(length, threshold)
Parameters:
length (simple int)
threshold (float)
detectTrendSupertrend(atrLength, multiplier)
Parameters:
atrLength (simple int)
multiplier (float)
detectTrendMOST(length, multiplier)
Parameters:
length (simple int)
multiplier (float)
analyzeTrendForTF(tf, config)
Parameters:
tf (string)
config (HTFConfig)
calculateStackConfluence(tfData, config)
Parameters:
tfData (array)
config (HTFConfig)
calculateAutoTuningParams(choppiness, stackStrength, config)
Parameters:
choppiness (float)
stackStrength (float)
config (HTFConfig)
detectStackSignals(state, prevState, config)
Parameters:
state (HTFStackState)
prevState (HTFStackState)
config (HTFConfig)
createStackPanel(state, config)
Parameters:
state (HTFStackState)
config (HTFConfig)
processHTFStack(state, config)
Parameters:
state (HTFStackState)
config (HTFConfig)
processHTFStackSignals(state, prevState, config)
Parameters:
state (HTFStackState)
prevState (HTFStackState)
config (HTFConfig)
newRedefiningTechnicalAnalysisCore(analysisConfig, timeframeConfig, strategy)
Initialize RedefiningTechnicalAnalysis Core Library
Note: This function requires valid config objects to be passed in
The configuration module must be used directly to create default configs
Parameters:
analysisConfig (AnalysisConfig)
timeframeConfig (TimeframeConfig)
strategy (StrategyTemplate)
performAnalysis(core, prices, volumes, timestamps)
Perform complete multi-timeframe analysis
Parameters:
core (RedefiningTechnicalAnalysisCore)
prices (array)
volumes (array)
timestamps (array)
generateSignal(core, analysisResult)
Generate trading signal from analysis results
Parameters:
core (RedefiningTechnicalAnalysisCore)
analysisResult (MultiTimeframeResult)
assessRisk(core, signal)
Assess risk for trading decision
Parameters:
core (RedefiningTechnicalAnalysisCore)
signal (SignalResult)
executeFullWorkflow(core)
Execute complete analysis workflow
Parameters:
core (RedefiningTechnicalAnalysisCore)
updateAnalysisConfig(core, newConfig)
Update analysis configuration
Parameters:
core (RedefiningTechnicalAnalysisCore)
newConfig (AnalysisConfig)
updateStrategy(core, newStrategy)
Update strategy template
Parameters:
core (RedefiningTechnicalAnalysisCore)
newStrategy (StrategyTemplate)
checkSystemHealth(core)
Perform system health check
Parameters:
core (RedefiningTechnicalAnalysisCore)
generateStatusReport(core)
Generate comprehensive status report
Parameters:
core (RedefiningTechnicalAnalysisCore)
enableDebugMode(core, enabled)
Enable debug mode
Parameters:
core (RedefiningTechnicalAnalysisCore)
enabled (bool)
setFeatureFlag(core, flag, enabled)
Set feature flag
Parameters:
core (RedefiningTechnicalAnalysisCore)
flag (string)
enabled (bool)
getFeatureFlag(core, flag, defaultValue)
Get feature flag
Parameters:
core (RedefiningTechnicalAnalysisCore)
flag (string)
defaultValue (bool)
resetLibraryState(core)
Reset library state
Parameters:
core (RedefiningTechnicalAnalysisCore)
getLibraryInfo()
Get library version information
quickAnalysis(config, tfConfig, strategy)
Quick analysis - simplified entry point
Parameters:
config (AnalysisConfig)
tfConfig (TimeframeConfig)
strategy (StrategyTemplate)
getQuickStatus(core)
Get quick status string
Parameters:
core (RedefiningTechnicalAnalysisCore)
Result
Generic Result type for safe operations with error handling and fallbacks
Fields:
floatValue (series float)
stringValue (series string)
boolValue (series bool)
intValue (series int)
isSuccess (series bool)
errorCode (series string)
errorMessage (series string)
floatFallback (series float)
stringFallback (series string)
boolFallback (series bool)
intFallback (series int)
operationContext (series string)
timestamp (series int)
tags (array)
ValidationResult
Comprehensive validation result with errors, warnings, and corrections
Fields:
isValid (series bool)
errors (array)
warnings (array)
corrections (array)
suggestions (array)
validationScore (series float)
validationMode (series string)
validatedFields (series int)
totalFields (series int)
validationContext (series string)
validationTime (series int)
PerformanceProfile
Simplified performance profiling for Pine Script limitations
Fields:
executionTimeMs (series float)
averageExecutionMs (series float)
executionCount (series int)
errorCount (series int)
cacheHits (series int)
cacheMisses (series int)
cacheHitRatio (series float)
estimatedArrayElements (series int)
hasHeavyCalculation (series bool)
lastOptimizationHint (series string)
performanceGrade (series string)
performanceScore (series float)
functionName (series string)
profileStartTime (series int)
HealthStatus
Simplified health status for Pine Script limitations
Fields:
isHealthy (series bool)
healthScore (series float)
healthGrade (series string)
issues (array)
warnings (array)
recommendations (array)
dataValidationOK (series bool)
calculationsOK (series bool)
memoryUsageOK (series bool)
errorCountSession (series int)
warningCountSession (series int)
lastHealthCheck (series int)
healthCheckVersion (series string)
AnalysisConfig
Comprehensive analysis configuration with factor weights, thresholds, and extensible options
Fields:
activeFactors (array)
factorWeights (map)
thresholds (map)
features (map)
tradingMode (series string)
consensusMode (series string)
riskProfile (series string)
minConfidence (series float)
signalStrength (series float)
requireConsensus (series bool)
minConsensusCount (series int)
parameters (map)
options (map)
flags (map)
configName (series string)
version (series string)
description (series string)
createdTime (series int)
lastModified (series int)
validation (ValidationResult)
TimeframeConfig
Multi-timeframe configuration with weights and adjustments
Fields:
timeframes (array)
weights (array)
autoDetectChartTF (series bool)
includeHigherTFs (series bool)
tfAdjustments (map)
tfSensitivity (map)
tfFeatures (map)
minTimeframes (series int)
consensusThreshold (series float)
consensusMethod (series string)
normalizeWeights (series bool)
adaptiveBias (series bool)
higherTFBias (series float)
tfConfigName (series string)
configTimestamp (series int)
validation (ValidationResult)
GenericAnalysis
Generic analysis result that all specific analysis types extend
Fields:
totalScore (series float)
confidence (series float)
action (series string)
strength (series string)
riskLevel (series string)
factorScores (map)
factorWeights (map)
factorSignals (map)
factorReasons (map)
analysisType (series string)
timeframeAnalyzed (series string)
analysisTimestamp (series int)
marketCondition (series string)
dataQuality (series float)
performance (PerformanceProfile)
validation (ValidationResult)
numericData (map)
textData (map)
flags (map)
ConsensusData
Multi-timeframe consensus analysis data
Fields:
agreementCount (series int)
totalTimeframes (series int)
agreementPercentage (series float)
hasStrongConsensus (series bool)
hasMajorityConsensus (series bool)
agreeingTimeframes (array)
disagreeingTimeframes (array)
tfScores (map)
tfActions (map)
consensusMode (series string)
consensusScore (series float)
consensusAction (series string)
consensusStrength (series string)
tfWeights (map)
weightedConsensus (series bool)
weightedScore (series float)
consensusQuality (series float)
consensusReliability (series string)
consensusWarnings (array)
SignalResult
Comprehensive trading signal result
Fields:
strongBuy (series bool)
buy (series bool)
neutral (series bool)
sell (series bool)
strongSell (series bool)
overallScore (series float)
confidence (series float)
primaryAction (series string)
signalStrength (series string)
signalReason (series string)
contributingFactors (array)
factorContributions (map)
triggerCondition (series string)
consensus (ConsensusData)
consensusLevel (series string)
hasConsensus (series bool)
riskLevel (series string)
riskRewardRatio (series float)
successProbability (series float)
signalTimestamp (series int)
urgency (series string)
validityPeriod (series int)
marketPhase (series string)
warningFlags (array)
metadata (map)
MultiTimeframeResult
Multi-timeframe analysis result container
Fields:
primaryAnalysis (GenericAnalysis)
tfResults (map)
consensus (ConsensusData)
aggregatedScore (series float)
confidenceScore (series float)
dominantAction (series string)
consensusStrength (series string)
analyzedTimeframes (array)
failedTimeframes (array)
failureReasons (map)
performance (PerformanceProfile)
validation (ValidationResult)
dataQualityScore (series float)
config (AnalysisConfig)
tfConfig (TimeframeConfig)
analysisTimestamp (series int)
DebugLogEntry
Debug log entry
Fields:
timestamp (series int)
level (series string)
module (series string)
function (series string)
message (series string)
context (series string)
data (map)
barIndex (series int)
timeframe (series string)
DebugLogger
Debug logger with configurable levels
Fields:
entries (array)
maxEntries (series int)
currentLevel (series string)
enabled (series bool)
enabledModules (array)
showTimestamp (series bool)
showBarIndex (series bool)
outputFormat (series string)
PerformanceMeasurement
Performance measurement
Fields:
name (series string)
startTime (series int)
endTime (series int)
duration (series float)
iterations (series int)
avgDuration (series float)
status (series string)
context (series string)
TraceEntry
Execution trace entry
Fields:
function (series string)
module (series string)
entryTime (series int)
exitTime (series int)
isEntry (series bool)
parameters (series string)
returnValue (series string)
depth (series int)
ExecutionTracer
Execution tracer
Fields:
traces (array)
currentDepth (series int)
maxDepth (series int)
enabled (series bool)
maxTraces (series int)
CacheEntry
Cache entry
Fields:
key (series string)
data (series string)
timestamp (series int)
ttl (series int)
accessCount (series int)
lastAccess (series int)
CacheManager
Cache manager
Fields:
name (series string)
entries (map)
maxEntries (series int)
defaultTTL (series int)
enabled (series bool)
hits (series int)
misses (series int)
evictions (series int)
RiskAssessment
Core risk assessment result
Fields:
riskLevel (series string)
riskScore (series float)
riskRewardRatio (series float)
successProbability (series float)
maxDrawdownExpected (series float)
positionRisk (series float)
portfolioExposure (series float)
correlationRisk (series float)
concentrationRisk (series float)
volatilityRisk (series float)
liquidityRisk (series float)
timeframeRisk (series float)
newsEventRisk (series float)
supportResistanceRisk (series float)
trendRisk (series float)
momentumRisk (series float)
volumeRisk (series float)
hasHighRisk (series bool)
hasExtremeRisk (series bool)
riskWarnings (array)
riskFactors (array)
recommendedPositionSize (series float)
stopLossDistance (series float)
takeProfitDistance (series float)
shouldAvoidTrade (series bool)
riskMitigationStrategy (series string)
assessmentTimestamp (series int)
assessmentMethod (series string)
performance (PerformanceProfile)
PositionData
Comprehensive position data
Fields:
hasPosition (series bool)
positionSide (series string)
positionSize (series float)
entryPrice (series float)
entryTimestamp (series int)
entryReason (series string)
unrealizedPnL (series float)
realizedPnL (series float)
maxUnrealizedGain (series float)
maxUnrealizedLoss (series float)
totalReturn (series float)
stopLossPrice (series float)
takeProfitPrice (series float)
riskAmount (series float)
riskRewardRatio (series float)
currentRisk (RiskAssessment)
barsInPosition (series int)
maxBarsAllowed (series int)
isTimedOut (series bool)
timeframe (series string)
hasExitSignal (series bool)
exitReason (series string)
exitScore (series float)
shouldExit (series bool)
exitUrgency (series string)
actionHistory (array)
timestampHistory (array)
reasonHistory (array)
sharpeRatio (series float)
maxDrawdown (series float)
winRate (series float)
avgHoldTime (series float)
StrategyTemplate
Base strategy template
Fields:
name (series string)
description (series string)
category (series string)
timeframes (array)
entryThreshold (series float)
entryConfidenceMin (series float)
requiredSignals (array)
excludeConditions (array)
exitThreshold (series float)
stopLossPercent (series float)
takeProfitPercent (series float)
maxBarsInTrade (series int)
maxPositionSize (series float)
basePositionSize (series float)
useVolatilityAdjustment (series bool)
useConfidenceAdjustment (series bool)
maxRiskPerTrade (series float)
maxDailyRisk (series float)
maxDrawdownLimit (series float)
useAdaptiveRisk (series bool)
requireConsensus (series bool)
minConsensusPercent (series float)
avoidNewsEvents (series bool)
requireVolume (series bool)
targetSharpeRatio (series float)
targetWinRate (series float)
targetRiskReward (series float)
parameters (map)
flags (map)
settings (map)
MetricDataPoint
Performance metric data point
Fields:
timestamp (series int)
value (series float)
name (series string)
unit (series string)
labels (map)
source (series string)
MetricStats
Metric statistics
Fields:
min (series float)
max (series float)
avg (series float)
sum (series float)
count (series int)
p50 (series float)
p95 (series float)
p99 (series float)
stdDev (series float)
firstTimestamp (series int)
lastTimestamp (series int)
MetricDataPointArray
Wrapper for array of metric data points (to avoid nested collections)
Fields:
dataPoints (array)
MetricsCollector
Metrics collector
Fields:
metrics (map)
stats (map)
maxDataPoints (series int)
retentionPeriod (series int)
autoCleanup (series bool)
enabled (series bool)
enabledMetrics (array)
lastCleanupTime (series int)
ComponentHealth
Component health status
Fields:
name (series string)
status (series string)
healthScore (series float)
lastCheckTime (series int)
warnings (array)
errors (array)
metrics (map)
lastError (series string)
errorCount (series int)
warningCount (series int)
isOperational (series bool)
SystemHealth
System health overview
Fields:
overallStatus (series string)
overallScore (series float)
healthyComponents (series int)
degradedComponents (series int)
unhealthyComponents (series int)
components (array)
systemWarnings (array)
systemErrors (array)
lastFullCheckTime (series int)
autoHealing (series bool)
healingAttempts (series int)
HealthAlert
Health alert
Fields:
level (series string)
component (series string)
message (series string)
timestamp (series int)
acknowledged (series bool)
category (series string)
ZoneDetection
Advanced zone data structure
Fields:
upper (series float)
lower (series float)
mid (series float)
height (series float)
score (series float)
quality (series string)
touchCount (series int)
lastTouchBar (series int)
creationBar (series int)
role (series int)
zoneType (series string)
isActive (series bool)
isBroken (series bool)
flipBar (series int)
flipRetestCount (series int)
flipBestQuality (series float)
flipScore (series float)
hasFlipped (series bool)
htfOverlap (series bool)
htfTimeframe (series string)
htfConfidence (series float)
retestQuality (series float)
volumeProfile (series float)
volatilityProfile (series float)
freshnessScore (series float)
successfulBounces (series int)
failedBreakouts (series int)
successRate (series float)
avgHoldTime (series float)
zoneBox (series box)
midLine (series line)
zoneLabel (series label)
flipLabel (series label)
ZoneDetectionConfig
Zone analysis configuration
Fields:
pivotPeriod (series int)
atrMultiplier (series float)
atrLength (series int)
maxZones (series int)
mergeThreshold (series float)
minTouchesForSignificance (series int)
weightTouches (series float)
weightFreshness (series float)
weightVolume (series float)
weightHTF (series float)
minWickPercent (series float)
maxBodyPercent (series float)
freshnessHalfLife (series int)
useHTFProjection (series bool)
htfTimeframe (series string)
htfPivotCount (series int)
htfProjectionMultiplier (series float)
ChannelConfig
Fields:
kcEmaLength (series int)
kcAtrLength (series int)
kcMultiplier (series float)
dcLength (series int)
bbLength (series int)
bbMultiplier (series float)
pivotLength (series int)
atrThreshold (series float)
minBarsPerLeg (series int)
minTouchCount (series int)
mergeThreshold (series float)
ChannelState
Fields:
kcUpper (series float)
kcLower (series float)
kcBasis (series float)
kcAtr (series float)
dcUpper (series float)
dcLower (series float)
dcMid (series float)
bbUpper (series float)
bbLower (series float)
bbBasis (series float)
bbStdev (series float)
squeezeRatio (series float)
isSqueezeActive (series bool)
isExpanding (series bool)
touchKcUpper (series bool)
touchKcLower (series bool)
touchDcUpper (series bool)
touchDcLower (series bool)
kcBreakoutUp (series bool)
kcBreakoutDown (series bool)
dcReentryUp (series bool)
dcReentryDown (series bool)
squeezeBreakUp (series bool)
squeezeBreakDown (series bool)
kcDepth (series float)
dcWidth (series float)
squeezeIntensity (series float)
ChannelSignal
Fields:
signalType (series string)
direction (series int)
strength (series float)
description (series string)
isQualitySignal (series bool)
VwapConfig
Fields:
pivotLeftBars (series int)
pivotRightBars (series int)
clusterTolerancePercent (series float)
minBarsBetweenSignals (series int)
crossThreshold (series float)
enableThrottling (series bool)
detectClusters (series bool)
VwapState
Fields:
sessionVwap (series float)
sessionVwapPrev (series float)
anchoredVwapHigh (series float)
anchoredVwapLow (series float)
hasAnchoredHigh (series bool)
hasAnchoredLow (series bool)
priceCrossUp (series bool)
priceCrossDown (series bool)
canShowPriceCross (series bool)
structureCrossUp (series bool)
structureCrossDown (series bool)
canShowStructureCross (series bool)
isClusterActive (series bool)
canShowCluster (series bool)
clusterTolerance (series float)
vwapsInCluster (series bool)
priceInCluster (series bool)
priceVwapPosition (series int)
priceVwapDistance (series float)
priceVwapDistancePercent (series float)
crossStrength (series float)
clusterStrength (series float)
structureStrength (series float)
VwapSignal
Fields:
signalType (series string)
direction (series int)
strength (series float)
description (series string)
isHighConfidence (series bool)
barIndex (series int)
VwapAnchors
Fields:
cumulativePV (series float)
cumulativeV (series float)
anchorPV_High (series float)
anchorV_High (series float)
hasHighAnchor (series bool)
anchorPV_Low (series float)
anchorV_Low (series float)
hasLowAnchor (series bool)
lastPriceCrossBar (series int)
lastStructureCrossBar (series int)
lastClusterBar (series int)
ZoneConfig
Fields:
htfTimeframe (series string)
useHTF (series bool)
maxZonesPerSide (series int)
rankFavorHTF (series bool)
rankFavorFVG (series bool)
rankFavorFresh (series bool)
showOnlyTopRank (series bool)
alphaTop (series int)
alphaRest (series int)
biasLength (series int)
biasBandMultiplier (series float)
targetMode (series string)
atrLength (series int)
atrSteps (series string)
sigmaLength (series int)
sigmaSteps (series string)
useSSL (series bool)
useFVGFills (series bool)
confirmMidline (series bool)
confirmBreak (series bool)
requireBias (series bool)
lazyTargets (series bool)
nearPercent (series float)
Zone
Fields:
top (series float)
bottom (series float)
mid (series float)
bornTime (series int)
isBull (series bool)
isHTF (series bool)
touched (series bool)
violated (series bool)
hasFVG (series bool)
score (series float)
rank (series int)
zoneBox (series box)
midLine (series line)
isActive (series bool)
ZoneState
Fields:
zonesTF (array)
zonesHTF (array)
bias (series int)
biasScore (series float)
biasRegime (series string)
vwapLevel (series float)
bandUpper (series float)
bandLower (series float)
targetLevels (array)
targetLines (array)
activeBullZones (series int)
activeBearZones (series int)
totalZones (series int)
avgZoneScore (series float)
longSignal (series bool)
shortSignal (series bool)
nearestBullZone (Zone)
nearestBearZone (Zone)
ZoneSignal
Fields:
signalType (series string)
sourceZone (Zone)
strength (series float)
description (series string)
confirmed (series bool)
barIndex (series int)
VolumeConfig
Fields:
profileMode (series string)
fixedLength (series int)
rollingLength (series int)
sessionString (series string)
binCount (series int)
valueAreaPercent (series float)
useHLC3 (series bool)
useHTF1 (series bool)
htfTimeframe1 (series string)
useHTF2 (series bool)
htfTimeframe2 (series string)
pivotLookback (series int)
pivotToleranceATR (series float)
enableAutoTuning (series bool)
vaPct_eff (series float)
epsATR_eff (series float)
adaptiveAlpha (series float)
choppinessLength (series int)
choppyThreshold (series float)
trendingThreshold (series float)
useMarketRegime (series bool)
enableLVNSignals (series bool)
enableVASignals (series bool)
maxRetestDistanceATR (series float)
useEMAFilter (series bool)
useSupertrendFilter (series bool)
useMOSTFilter (series bool)
showPOC (series bool)
showValueArea (series bool)
showNodes (series bool)
showSilhouette (series bool)
silhouetteOffset (series int)
silhouetteWidth (series int)
zoneOpacity (series int)
enableSessionSplits (series bool)
maxSessionCount (series int)
VolumeNode
Fields:
price (series float)
volume (series float)
nodeType (series string)
prominence (series float)
isSignificant (series bool)
VolumeProfile
Fields:
pocPrice (series float)
pocVolume (series float)
valueAreaHigh (series float)
valueAreaLow (series float)
totalVolume (series float)
windowStart (series int)
windowLength (series int)
windowHigh (series float)
windowLow (series float)
binVolumes (array)
binPrices (array)
hvnNodes (array)
lvnNodes (array)
nearestLVN (series float)
nearestHVN (series float)
htfConfluence (series bool)
pocLine (series line)
valueAreaBox (series box)
nodeBoxes (array)
silhouette (series polyline)
VolumeState
Fields:
currentProfile (VolumeProfile)
sessionProfiles (array)
trendBullish (series bool)
emaConfluence (series float)
supertrendBull (series bool)
mostBull (series bool)
choppiness (series float)
isChoppy (series bool)
isTrending (series bool)
marketRegime (series string)
vaPct_current (series float)
epsATR_current (series float)
smoothingFactor (series float)
longLVNSignal (series bool)
shortLVNSignal (series bool)
longVASignal (series bool)
shortVASignal (series bool)
volumeScore (series float)
passFilter (series bool)
inValueArea (series bool)
abovePOC (series bool)
pocRising (series bool)
nearLVN (series bool)
VolumeSignal
Fields:
signalType (series string)
direction (series int)
strength (series float)
description (series string)
triggerPrice (series float)
hasConfluence (series bool)
barIndex (series int)
HTFConfig
Fields:
timeframes (array)
tfWeights (array)
autoSelectTFs (series bool)
maxTimeframes (series int)
trendLength (series int)
trendThreshold (series float)
trendMethod (series string)
stackThreshold (series float)
requireAllTFs (series bool)
confluenceBonus (series float)
enableAutoTuning (series bool)
choppinessLength (series int)
choppyThreshold (series float)
trendingThreshold (series float)
showStackPanel (series bool)
panelPosition (series string)
panelRows (series int)
panelCols (series int)
showTooltips (series bool)
HTFTrendData
Fields:
timeframe (series string)
trendStrength (series float)
trendDirection (series string)
confidence (series float)
isValid (series bool)
weight (series float)
trendColor (series color)
HTFStackState
Fields:
tfData (array)
bullConfluence (series float)
bearConfluence (series float)
stackStrength (series float)
stackBias (series string)
choppiness (series float)
isChoppy (series bool)
isTrending (series bool)
marketRegime (series string)
vaPct_eff (series float)
epsATR_eff (series float)
adaptiveAlpha (series float)
bullStackSignal (series bool)
bearStackSignal (series bool)
stackBreakSignal (series bool)
stackTable (series table)
tfLabels (array)
strengthBars (array)
RedefiningTechnicalAnalysisCore
Main library state container
Fields:
analysisConfig (AnalysisConfig)
timeframeConfig (TimeframeConfig)
activeStrategy (StrategyTemplate)
lastAnalysis (MultiTimeframeResult)
lastSignal (SignalResult)
lastRisk (RiskAssessment)
currentPosition (PositionData)
isInitialized (series bool)
lastUpdateTime (series int)
currentTimeframe (series string)
globalPerformance (PerformanceProfile)
systemHealth (SystemHealth)
metricsCollector (MetricsCollector)
analysisCache (CacheManager)
calculationCache (CacheManager)
recentErrors (array)
recentWarnings (array)
errorCount (series int)
warningCount (series int)
debugLogger (DebugLogger)
debugMode (series bool)
extensionData (map)
featureFlags (map)

Free Stock ScreenerMissing great trade opportunities is annoying, and unless you have 12 screens or only trade one market, you are missing a lot of trades. To fix that, we created this free stock screener so you get notified instantly of potential great trading conditions in real time, right on your chart.
You get notified of trading benchmarks being met by the value being displayed on the scanner as well as a color change so that it grabs your attention and makes you aware that you should take a look at the other market and look for a potential trade. It also has built in alerts so you can have an alert notification go off when any of your trading conditions are met instead of needing to watch the scanner for color changes.
The screener will change the ticker symbol background color to red green when price is above or below the previous daily range and above or below both VWAPs. This signals that the ticker is trending, which typically means it is a great time to trade that market and follow the trend.
This free stock screener allows you to scan up to 10 different markets at the same time for various different conditions so you always know what is going on with your favorite trading symbols. If you want to scan more tickers, just add the indicator to your chart again and change the table position to the other side of the screen and update the tickers on the 2nd screener, allowing you to have 20 tickers at a time.
The scanner can be fully customized by changing the markets that it screens and turning on or off as many of them as you would like. You can also turn on or off any of the different data sets so that you only get information about trading conditions that matter to you.
The screener can provide data on any type of market, such as stocks, crypto, futures, forex and more. Each ticker can be adjusted to whatever market you would like it to scan for data in the settings panel, the only limitation is that it will not provide data for the VWAP and volume trend score if the ticker you are screening does not provide volume data.
Screener Features
The scanner will provide the following types of data for each ticker that is turned on:
Volume - Provides a volume score compared to the average volume and notifies you of higher than normal volume and volume spikes on individual bars by changing colors.
Volatility - Provides a volatility score compared to the average volatility and notifies you of higher than normal volatility by changing colors.
Oscillator - Choose between the RSI or CCI. The value of that oscillator will be displayed and will notify you when values are in extreme ranges such as overbought or oversold conditions according to the threshold values you enter in the settings panel. When those thresholds have been breached, you will be notified by it changing color.
Big Candles - Compares the current candle to average previous candle sizes, and changes color to notify you of big candles including a big top wick, big bottom wick, big candle body and big candle high to low range.
Daily Level Touches & Trends - Calculates and displays various daily candle and intraday open price levels that act as support and resistance. Notifies you when price is touching any of the daily levels that are turned on. The levels you can have on are as follows: previous day high, previous day low or previous day open. It also will notify you when price is touching the current day’s open, NY 930am open, Asia 8pm open, London 2am open and NY midnight 12am open. It will also say “Above” if price is above the previous day’s high or it will say “Below” if price is below the previous day’s low. The color of the cell will also change when a level touch is happening or price is above the previous day high or below the previous day low.
VWAP - Choose from 2 different VWAP lengths, default settings are daily and weekly VWAPs. You will get notified if price touches either of the VWAPs and they will also say “Above” or “Below” if price is currently above or below each VWAP.
How To Use The Screener To Help You Trade
The main purpose of the screener is to scan other markets and notify you of potential good trading opportunities such as price bouncing off of the daily levels or VWAPs. It can also be used to know when price is trending according to the VWAPs and daily levels. Lastly, you can use it to know how the volume and volatility trends are currently which gives you more confidence in taking a trade with this data when volume and volatility are present.
Volume Score
When volume is high, this represents a good time to trade because there are many market participants and price is likely to be volatile while there is high volume which can present a lot of good trade setups for you to take.
The volume score shown on the screener measures the current volume trend compared to previous volume trends and calculates that into a score based on 100 being the same as the previous volume trend. So any value above 100 means it is high volume and any value less than 100 means it is lower volume than normal.
In the settings panel, you can adjust the volume threshold that needs to be met for a volume notification to show up. The default setting is at 120, so you will get notified when the current volume trend score is 120 or higher or you can adjust that threshold value to whatever value you prefer.
It also will notify you when there is a volume spike on the current bar. This is determined by calculating an average of the recent volume totals and then checking to see if the current bar is greater than or equal to that average multiplied by 3. So if a single bar has volume that is greater than 3 times what the average volume is, then you will get a notification that says “Spike” to make you aware of that volume spike.
The volume trend threshold, volume spike multiplier and lookback length for the average volume used in volume spike calculations can all be adjusted in the settings panel to fit your desired preferences.
Volatility Score
High volatility can mean it is a great time to trade because the market is moving quickly and providing large enough movements that you can get in and out in a short amount of time, while still accruing decent sized trade PnL.
The volatility score will calculate the current volatility for each market compared to previous conditions and then divide the current volatility by the average volatility to give you a volatility score. Anything over 100 means the market is decently volatile and you should look at that market to find potential trade setups to execute on. Anything below 100 means the market is not very volatile and it is usually best to just wait until volatility returns before you start trading again.
The screener will notify you when the volatility score is above the threshold you set. The default value is set to 90, but can be adjusted to your preference. Pay attention to any market that shows an alert and take a look at that chart because the high volatility may present a good trade setup for you in the near future.
Oscillator Score
The oscillator data can be switched between Relative Strength Index(RSI) and Commodity Channel Index(CCI).
The RSI provides a value between 0 and 100 that indicates the momentum and strength of the recent price action. Many traders use the extremes of the 0-100 range to signal overbought or oversold conditions and use that as a sign to look for price to reverse in the near future. The typical values used for this and the default settings to provide notifications are: 70 for overbought and 30 for oversold. The scanner will notify you when the RSI value is considered overbought or oversold so you know to take a look at the chart and analyze if it is ready for a trade to be taken.
The CCI provides a value that can be used to determine the trend strength of the underlying asset when the oscillator moves above 100 or below -100. These extreme values are outside of the normal accumulation range and signify that price is moving strongly in that direction so it may be a good time to take a trade in the direction of the trend. The scanner will show you the value of the CCI for each market and notify you if that value is above 100 or below -100.
Both RSI and CCI settings can be adjusted in the settings panel to your desired settings so you have the exact oscillator settings you prefer to use as well as the exact values that you want to use for being notified.
Big Candles
Big candles can mean that many traders are buying or selling at the same time and many times indicate a good signal to trade in that same direction. That is why we included this calculation in the screener, so you are always aware when a large candle prints.
It calculates the average size of the recent candles and then uses that average as the benchmark to determine if the current candle is considered big and worthy of notifying you to take a look at that chart.
You can adjust the multiplier used for the big candle threshold to whatever you desire, but the default setting is 3 which means the candle will be considered big and notify you if it is 3 times as large as an average candle.
The big candles data will track the following candle values and notify you with these labels:
High to Low candle size = HL
Candle Body from open to close candle size = OC
Top Wick size = TW
Bottom Wick size = BW
Daily Level Touches & Trend
Daily level touches are excellent levels to watch for price to bounce because they often act as support and resistance levels for intraday trading. The scanner will track each market and notify you when the current candle is touching any of the daily levels that you have turned on in the settings panel.
The main levels that are turned on by default and are useful for all markets and how they will be labeled on the scanner are as follows:
Previous Day High = High
Previous Day Low = Low
Previous Day Open = < Open
Previous Day Close = Close
Current Day Open = Open
We also included some extra levels that are useful for futures traders. They are as follows:
NY 930am Open = 930am
NY 12am Midnight Open = 12am
Asia Open at 8pm NY time = Asia
London Open at 2am NY Time = London
Watch how price reacts to these levels and then trade the bounces off of these levels if the price action confirms that it is going to respect that level.
When price is currently above the previous day high, the scanner will say “Above” and show a green color, indicating a bullish trend and that price is above the previous daily candle’s high.
When price is currently below the previous day low, the scanner will say “Below” and show a red color, indicating a bearish trend and that price is below the previous daily candle’s low.
Pay attention to when price is trending above or below the previous daily candle as those trends can provide excellent trend trading opportunities.
The daily levels that you have turned on in the settings will also show as lines on the chart and include a label next to them, identifying each level so you know what each line represents. You can turn on or off all of the lines shown on the chart in the main settings or turn them off one by one in the style panel of the settings. Labels can also be turned on or off for all of the lines in the main settings panel. You can adjust the label positioning in the Label Offset section of the settings panel.
VWAP Touches & Trend
VWAP stands for volume weighted average price and is a very popular tool that traders use to determine trend direction based on volume as well as an excellent level to trade price bounces off of.
The typical VWAP time period used is Daily, which means the volume weighted average price will reset at the beginning of a new day. We set the first VWAP to be the daily VWAP by default and the second one to be the weekly VWAP. You can adjust both of the time periods to be any of the provided time lengths that you choose.
The screener will show “Above” with a green background color when price is above the VWAP, indicating a bullish trend. It will show “Below” with a red background color when price is below the VWAP, indicating a bearish trend. When both VWAPs are showing Above or Below, you can expect price to trend in that direction, so look for pullbacks you can trade in the direction of the trend. If the VWAPs are showing different directions, then you should expect to bounce back and forth between the VWAPs, but be careful and watch out for price to break beyond either one and start a trend.
When the current candle is touching the VWAP, the scanner will change colors and say VWAP to notify you that price is touching the VWAP and you should look at that chart and analyze the market for a potential bounce off of the VWAP to trade.
Trending Market Signals
Strong trends are excellent markets to trade and can many times provide excellent trading opportunities that don’t require expert price action reading skills to be able to take winning trades from. That is why we included a signal to notify you of a strong trending market.
The strong trending market will show up as a green or red background color for the ticker name. If the color of the ticker name is green, it is notifying you that the price is above the previous daily high, above VWAP 1 and above VWAP 2 and is a good market to look for bullish trend trades. If the color of the ticker name is red, it is notifying you that the price is below the previous daily low, below VWAP 1 and below VWAP 2 and is a good market to look for bearish trend trades.
Changing The Tickers It Scans
To change the tickers that the indicator scans, scroll near the bottom of the settings panel and select the ticker symbol you want to update and then search for the exact symbol you want to use. If you want to scan less tickers, then just turn some of the tickers off that you don’t need.
Scanning More Than 10 Tickers
If you want to scan more than 10 tickers, you can add the scanner to your chart again and then just change the table position to the other side of the screen. This will allow you to scan 10 more tickers that will show up separately. Then if you want even more, just add the indicator to your chart again and update the table position until you have as many markets as you want. The table position setting can be found at the bottom of the main settings panel.
Alerts
The screener has alerts that can be used to notify you when any of the data set thresholds have been met or if price is touching one of the levels. You can set alerts for the following events:
Bullish Trend Alert - Price is above the previous daily high and above both VWAPs.
Bearish Trend Alert - Price is below the previous daily low and below both VWAPs.
High Volume Alert - Volume is higher than the threshold or a volume spike is detected.
High Volatility Alert - Volatility is higher than the threshold.
Oscillator Is Extended Alert - Oscillator value has exceeded the upper or lower threshold.
Big Candle Alert - A big candle has been detected.
Daily Level Touch Alert - One of the daily levels that is turned on is being touched.
VWAP Touch Alert - One of the 2 VWAPs are being touched.
An alert will trigger when any one of tickers on your scanner meets the alert conditions, so when you see the alert, you will need to go to your chart and look at the scanner to see which ticker it was and then navigate to that chart to look for potential trade setups.
The alerts will use the exact same settings you have configured in the settings panel to send you alert notifications. With normal settings, this could give you a lot of alerts, so if you only want alerts to fire when abnormal conditions are being met, try setting up a second screener on your chart that has very high threshold values and only has the most important level touches on. Then turn the setting "Do Not Show The Screener On The Chart" to off so the calculations will still run and fire alerts, but won't clog up your charts. This way you can only get alert notifications when major events happen but still have your normal screener settings available on your chart.
Markets This Can Be Used On
This screener uses the price action and volume data so you can use it to scan any type of market you would like as long as the ticker you are scanning has price and volume data feeds. If a market does not have volume data, then it will just show NaN in the volume row and the VWAP rows will not show anything.

5-Min EMA MACD RSI Scalping (MACD 5 Candles Confirm) - BVK 🔹 5-Min EMA MACD RSI Scalping Strategy – Full Description
The 5-Min EMA MACD RSI Scalping Strategy is a powerful intraday trading technique designed for quick trades on lower timeframes, mainly the 5-minute chart. It combines trend confirmation (EMA), momentum analysis (MACD), and overbought/oversold signals (RSI) to capture short, high-probability price moves in both bullish and bearish markets.
⚙️ Indicators Used:
Exponential Moving Averages (EMA)
EMA 9 – Fast-moving average for entry trigger.
EMA 21 – Medium-term average for trend confirmation.
When EMA 9 crosses above EMA 21 → Bullish bias.
When EMA 9 crosses below EMA 21 → Bearish bias.
MACD (12, 26, 9)
Confirms momentum and possible entry zones.
Bullish confirmation: MACD line crosses above signal line.
Bearish confirmation: MACD line crosses below signal line.
RSI (14-period)
Filters out false signals.
Buy zone: RSI rising above 40–50.
Sell zone: RSI falling below 60–50.
Avoid trades when RSI is near 70 (overbought) or 30 (oversold).
💡 Entry Rules:
Buy Setup (Long Trade):
EMA 9 crosses above EMA 21.
MACD line crosses above signal line (positive momentum).
RSI is above 50 but below 70 (confirming strength).
Enter trade at candle close.
Sell Setup (Short Trade):
EMA 9 crosses below EMA 21.
MACD line crosses below signal line.
RSI is below 50 but above 30 (confirming weakness).
Enter trade at candle close.
🎯 Exit Rules:
Take Profit: 1.5x to 2x of risk or near the opposite EMA crossover.
Stop Loss: Below/above recent swing low/high or 0.3–0.5% away from entry.
Optional trailing stop using EMA 9 for dynamic exits.
📊 Best Timeframes & Assets:
Works best on 5-minute charts.
Suitable for Forex, Indices, Cryptocurrency, and Stocks with good liquidity.
Avoid major news events or low-volume sessions.
⚠️ Tips for Best Results:
Trade only during high-volume market sessions (e.g., London/New York overlap).
Always confirm trend direction on higher timeframes (15m or 1H).
Avoid overtrading—wait for clear signal confluence (EMA + MACD + RSI).
🧠 Strategy Summary:
“EMA gives you the trend, MACD gives you momentum, and RSI keeps you disciplined.”
This strategy is simple yet effective for traders who prefer quick in-and-out trades within minutes, offering a structured approach to scalping with reduced emotional bias.